Sentinel-2 captured the fault line through Palu, Indonesia
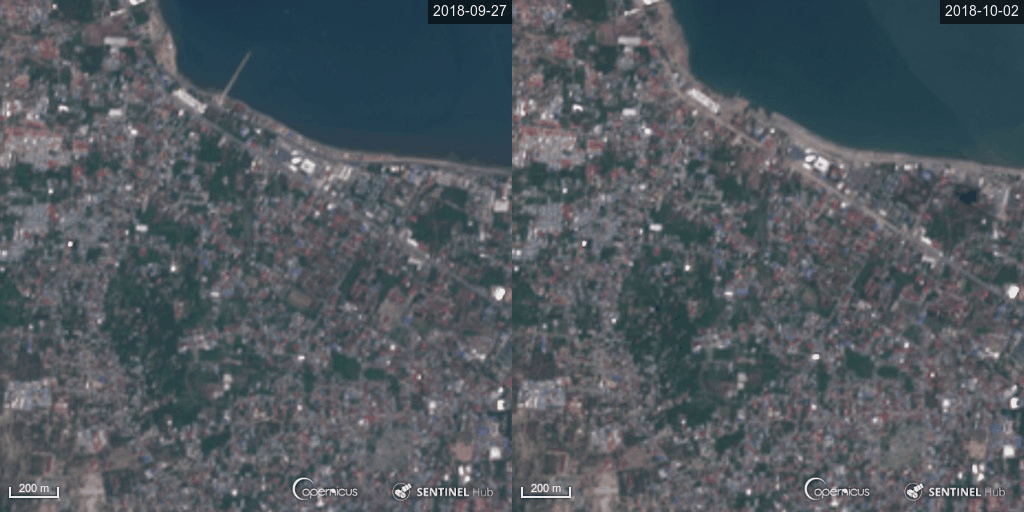
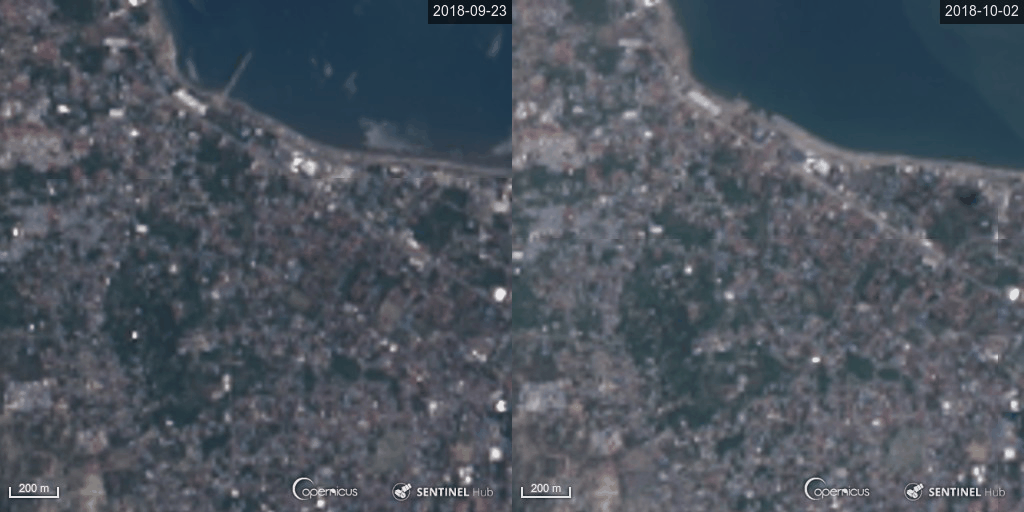
On Sep 28 a 7.5 magnitude earthquake struck the city of Palu, in Sulawesi Indonesia. The quake was followed by a tsunami. The animation below shows two Sentinel-2 images before and after the earthquake in Palu. If you look closely you can see the horizontal displacement due to the fault movement through the city. It also shows the damages caused by the tsunami wave.
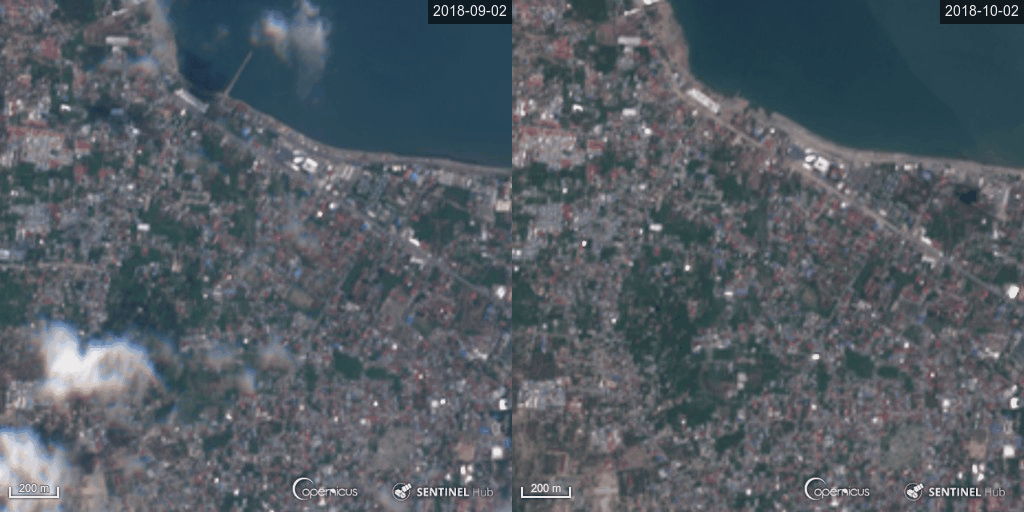
Apart from the fault line there is a general shift between the images due to an inaccurate multi-temporal geolocation of Sentinel-2 images. A reprocessing is planned by ESA to improve the coregistration of Sentinel-2 images using ground control points from a global reference image. The post-event image was acquired by Sentinel-2A on October 02. The coregistration is better if one take as a pre-event image an image acquired by Sentinel-2A too on September 02.
By the way, the fault movement is also visible using Landsat: 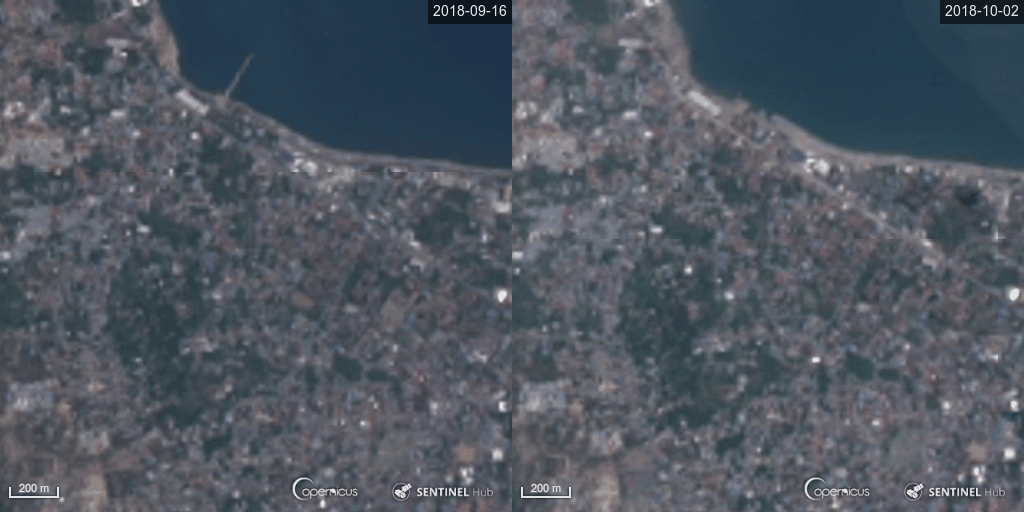
But the mis-registration is also evident if Landsat images are taken from two different orbits:
Definitely a shaky place..
At larger scale, the same images reveal the landslides which occurred in the aftermath of the earthquake (click on the image to compare both images with a slider)
This could be the worst landslide disaster in five years.