TRISHNA : Thermal infraRed Imaging Satellite for High-resolution Natural resource Assessment
Introduction
The monitoring of the water cycle at the Earth surface which tightly interacts with the climate change processes as well as a number of practical applications (agriculture, soil and water quality assessment, irrigation and water resource management, etc…). It requires surface temperature measurements at local scale. Such is the goal of the Indian-French high spatio-temporal TRISHNA mission.
The TRISHNA satellite embarks both a thermal infrared instrument and a visible and short-wave infrared instrument, that will scan the entire earth surface every 3 days. The launch date is end of 2024, for a five-year mission.
TRISHNA scientific objectives are the following (typical examples in brackets): ecosystem stress and water use (better management of water resources), coastal and inland waters (water quality, fish resource, sea ice), urban microclimates monitoring (characterization of urban heat island), solid earth (detection of thermal anomalies), cryosphere (monitoring of snow and ice), atmosphere (water content, cloud characterization).
The scientific community involved in climate change studies, for whom sea and land surface temperatures are key variables, are expecting to make significant progress thanks to TRISHNA.
Moreover, TRISHNA will deliver innovative products for water resource management, that can enlighten decision-making at all levels, from farmer (water stress status, irrigation) to institutional (land-use management and policy, climate change impact mitigation).
TRISHNA will also contribute to the preparation of future COPERNICUS services, by pushing new instrumental techniques, and through the preparation and validation of the data processing chains, the products and the applications.
TRISHNA mission and objectives
Trishna Mission results from a long quest by remote sensing pioneers at INRA, CESBIO, CNES, to obtain a high resolution infra-red mission to monitor evapo-transpiration. Thanks to the constance and determination of Jean-Pierre Lagouarde (INRA), the long awaited land IRT mission is now coming close to reality, thanks to the support of CNES and ISRO agencies. Jean-Pierre is now retired, and the mission is led by two principal investigators, Dr Jean-Louis Roujean (CESBIO), and Dr Bimal K. Bhattacharya (ISRO).
Here is a short summary of the mission objectives:
Ecosystem stress and water use (design driver)
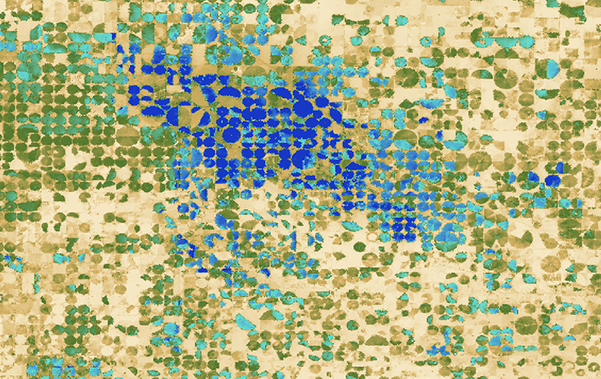
Land Surface Temperature (LST) is a key information to estimate evapotranspiration (ET), a crucial component of the water cycle. For agriculture, which represents about 70% of the water consumption at global scale, applications to stress detection and irrigation optimization techniques are expected for a better management of water resources, improved crop production forecast and food security assessment. As CO2 and water transfers in plants are tightly coupled, and as water is the vector of many dissolved materials within the soil, LST can help to monitor biogeochemical cycles with applications to water quality and soil pollution monitoring. Dealing with hydrology, improved estimation of ET at watershed scale should also facilitate the closure of water budgets and estimation of infiltration, runoff, river flow, etc… Other application will be found in the field of ecology (e.g. mapping of microclimates, permafrost melting).
Coastal and inland waters (design driver)
A better assessment of the sub-mesoscale activity in relation with coastal ecosystems productivity and of gas fluxes (CO2, CH4) at the air-sea interfaces is expected from high spatiotemporal resolution Sea Surface Temperature (SST). The availability of such SST data opens the way to a large number of applications: water quality, algae blooms, fish resource, fresh water resurgences, water discharges and storm surges (e.g. pollutants, thermal plumes) among others. Moreover, the surface temperature of lakes has been defined as an essential climate variable (ECV) by GCOS (Global Climate Observing System). The study of sea ice (extent, growth/decay of ice, feedback with climate) will also benefit from TRISHNA data.
Urban microclimates monitoring
More and more efforts are devoted to the characterization of urban heat islands (UHI) and to their possible mitigation or heat action plans for comfort of inhabitants (by ’greening’ of the city, urban planning or control of air conditioning energy consumption for instance). Improved evaporation estimations should also provide better inputs for urban and peri-urban hydrology studies.
Solid Earth
TRISHNA should improve the detection of thermal anomalies with various applications: peat or coal fires mapping, geothermal exploration, possibly earthquakes precursors, among others. It could also contribute to the monitoring of volcanic activity through the early detection of lava hot spots.
Cryosphere
The feedbacks between climate and melting processes make the monitoring of snow and ice critical in polar regions. It is also particularly important for glaciers and glacial high altitude lakes in mountainous regions as the snow and glacier melt runoff represents a perennial source of water for river basins. This is crucial for India which is partly dependent on Himalayan cryosphere.
Atmosphere
Different information on atmosphere (precipitable water content) and clouds (type, height) can be derived from thermal infrared data for improving Earth radiative budgets.
TRISHNA project organization and workshare
The TRISHNA project is managed by an Indian-French joint project team. The workshare between both countries is explicited in the following graph :
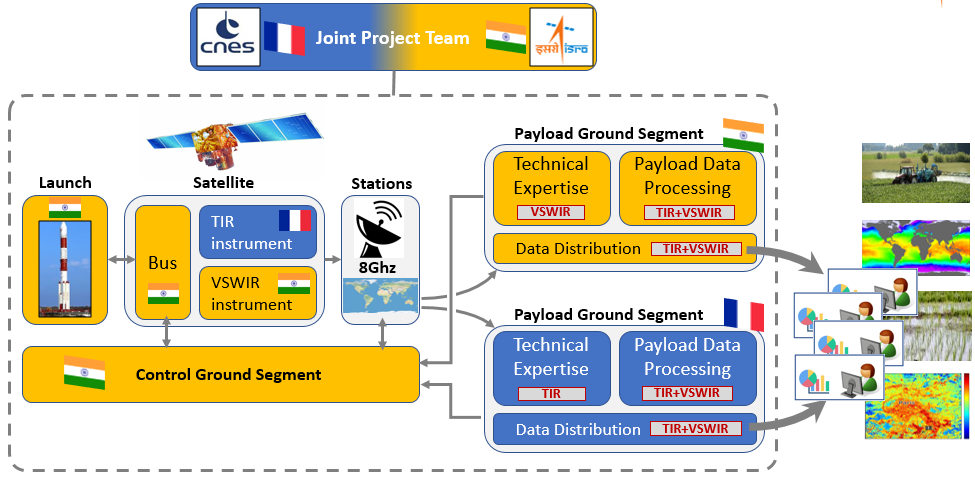
Each of the Indian and French payload ground segments can process and distribute all types of TRISHNA products: indeed, the data processing uses the mutual enrichment resulting from the gathering of reflective and thermal data acquired at the same time by both instruments. Hence, the Indian and French payload data processing chains are functionally identical.
Trishna Mission characteristics
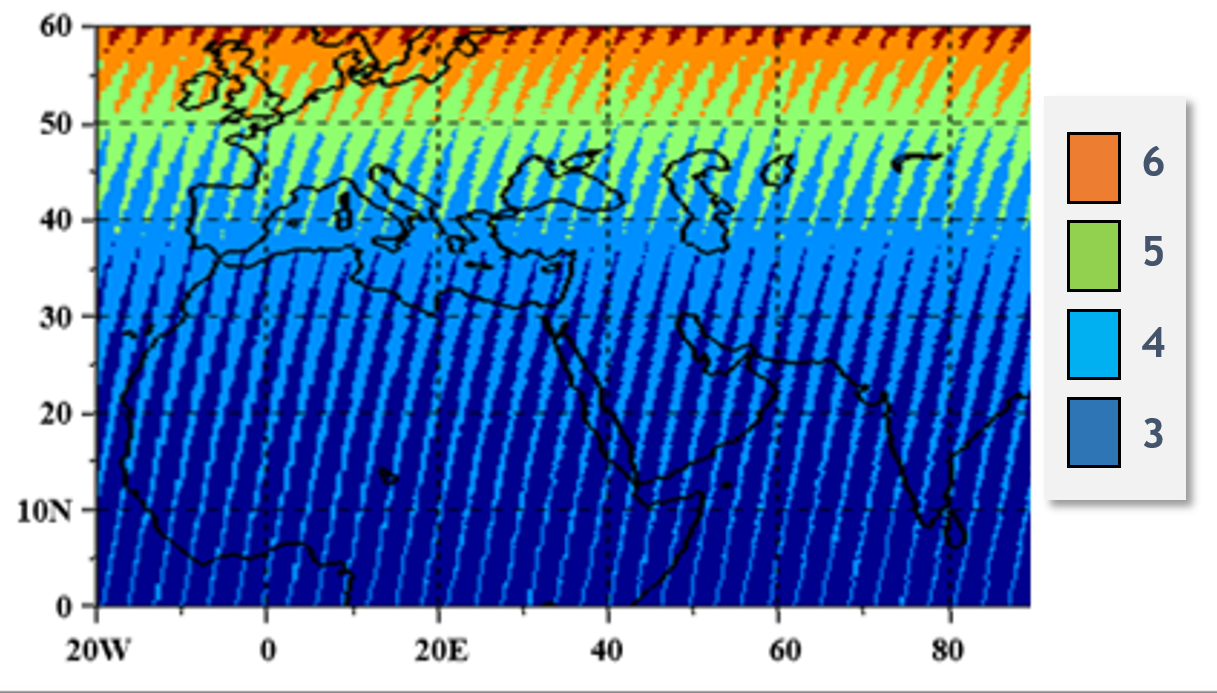
Trishna’s orbit has a cycle of 8 days: in other words, every 8 days, Trishna is exactly at the same place, above the same pixel. But thanks to the very large field of view, of its instruments, Trishna can observe each point on the earth at least three times per 8 days cycle. As a result, the revisit period is always better than three days everywhere on Earth, but the observations are made with different viewing angles. But the chosen orbit allows Trishna to make observatios with constant viewing angles every 8 days.
VSWIR Instrument
Trishna's data sheet
| Trishna Mission feature | Value |
| Launch vehicle | PSLV |
| Launch date | End 2024 (at best...) |
| Mission lifetime | 5 years (+2) |
| Bus | IRS |
| Payloads | VSWIR instrument + TIR instrument |
| Data coverage | Global, day (VSWIR+TIR) and night (TIR only) |
| Orbit type | Polar phased sun-synchronous |
| Orbit cycle | 8 days (same view angle) |
| Revisit | 3 passes every 8 days (different view angles) |
| Altitude | 761km |
| Overpass time at equator | 1PM (Descending Node) |
| Pixel size (land and coastal) | 57m (nadir) to 90m |
| Pixel size (deep ocean) | 1 km |
| Swath width | 1026 km |
| Scan angle | +/- 34 deg |
| Data rate | 640 Mbps |
| Data latency | 12 hours on selected products (L2) |
| Data policy | Free and open (specific agreements may be required) |
The VSWIR instrument is made of 6 small cameras, 3 for the VNIR bands, and 3 for the SWIR bands. The 3 cameras per wavelength range are necessary to cover the whole field of view. Each camera contains all the bands of the selected range.
VSWIR spectral bands radiometric characteristics:
Discussion are on-going to include a band at 910 nm
Trishna VNSWIR spectral bands
| Band name | Wavelength Center (nm) | FWHM (nm) | Purpose | Ltyp(W/m2/sr/µm) | Lmax (W/m2/sr/µm) | Required SNR @ Ltyp |
| Blue | 485 | 70 | Detection of low clouds | 30 | 663.5 | 50 |
| Green | 555 | 70 | Coastal, sediments, snow | 30 | 600.5 | 100 |
| Red | 670 | 60 | Vegetation (LAI, fCOVER, NDVI, …) | 20 | 486.1 | 100 |
| NIR | 860 | 40 | Vegetation (LAI, fCOVER, NDVI, …) | 30 | 325.3 | 100 |
| Cirrus | 1380 | 30 | Detection of thin cirrus clouds | 6 | 55.0 | 25 |
| SWIR | 1610 | 100 | AOD, snow/cloud discrimination, vgt stress, burnt areas | 4 | 77.9 | 100 |
TIR Instrument
A rotating scan mirror allows the telescope to view a 68 degrees-wide nadir cross-track swath as well as – for calibration – an internal blackbody and cold-space view every 5 seconds. The optical signal is focused by a telescope onto the 60 K focal plane containing a mercury-cadmium-telluride infrared detector array. Spectral filters on the focal plane define 4 spectral bands in the 8-12 μm range.
Trishna's TIR instrument
| TIR instrument feature | Value |
| Mass | 165 kg |
| Power | 245 W |
| Optics | Three-mirror anastigmat telescope |
| Number of spectral bands | 4 |
| Band names | TIR1 – TIR2 – TIR3 – TIR4 |
| Specified central wavelengths | 8.65µm – 9.0µm – 10.6µm – 11.6µm |
| Specified FWHM per band | 0.35µm – 0.35µm – 0.7µm – 1.0µm |
| Radiometric accuracy | 0.7K at 300K |
| Radiometric typical precision (NedT) | 0.15K at 300K |
| Dynamic range | 250K – 400K |
| Aperture size | 150mm |
| Focal length | 400mm |
| Focal plane temperature | 60K |
| On-board calibration | 1 blackbody + 1 cold space view |
| Scan cycle | 5 sec |
TRISHNA products
The free and open data policy intends to maximize the use of the data, in order to enhance scientific knowledge and maximize scientific benefit, but also with the objective of promoting the development of applications for societal benefit.
Product levels 1, 2 and 3 will be available to the users.
Level 1 products (top-of-atmosphere values, together with a coarse cloud mask, resampled onto a cartographic grid) are top-of-atmosphere reflectances (visible and swir) and top-of-atmosphere radiances (thermal infrared wavelengths) and brightness temperatures.
Level 2a products are single-date radiative variables that may be processed differently according to their nature: the products include scene classifiation and atmospheric variables. Data delivered are surface reflectance (in reflective domain) after atmospheric correction, albedo, surface radiance in thermal infrared after atmospheric correction, temperature and emissivity.
Level 2b are biophysical variables computed using level 2a variables together with exogeneous sources of information (models). Typical level 2b variables for ecosystem stress are LAI (leaf area index), FVC (fractional vegetation cover), FAPAR (Fraction of Absorbed Photosynthetically Active Radiation). Variables associated to the energy budget at soil-plant-atmosphere interface are also delivered: net radiation, evapotranspiration, water stress index.
Level 3 are temporal syntheses (decadal, monthly) of level 2 variables.
Rédigé par :
Philippe Gamet, Jean-Pierre Lagouarde, Jean-Louis Roujean, Olivier Hagolle