Sentinel-2 Level-3A time series
A few days ago, the Theia land data centre released the July 2020 monthly cloud free synthese of surface reflectances from Sentinel-2, for France, but also Italy, Spain, Switzerland, Belgium, Netherlands, the Northern part of Maghreb and Madagascar, and a large part of Sahel The distribution site of Theia products at CNES now provides more than three years of L3A products. Over France, for the third year in a row, the July 2020 synthesis shows the effects of an intense drought which set up this summer. It probably worsened in August, we will see that in a few days.

Summer 2017 was a rather wet and cloudy period, with some pixels still cloudy after 45 days. There is a deep contrast between the healthy vegetation observable in 2017, and the brown hue observable for 2018 , 2019 and 2020 very dry summers. This is also all the more observable in the zoom over the center of France, provided below.
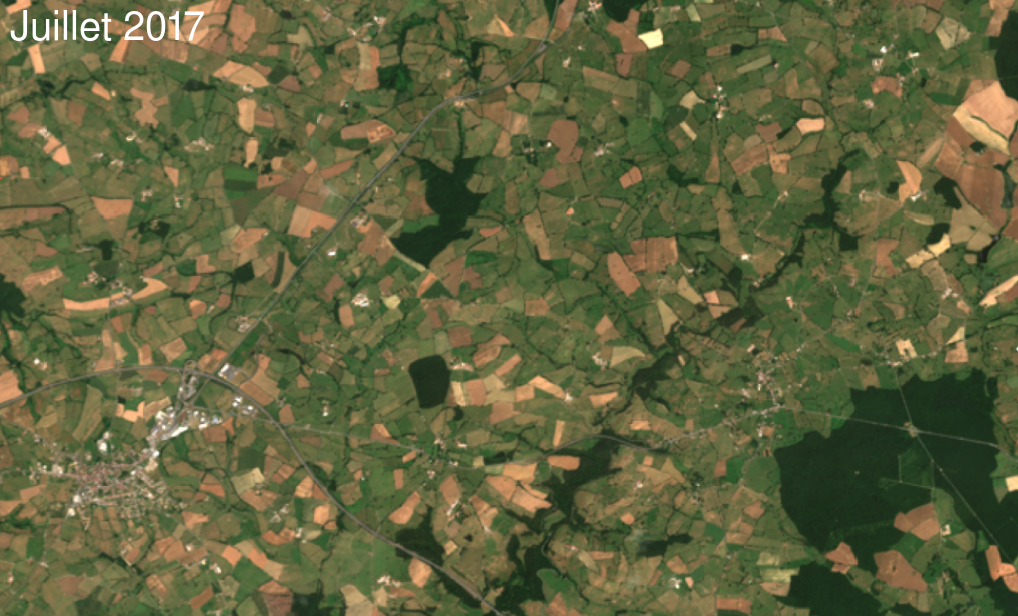 | 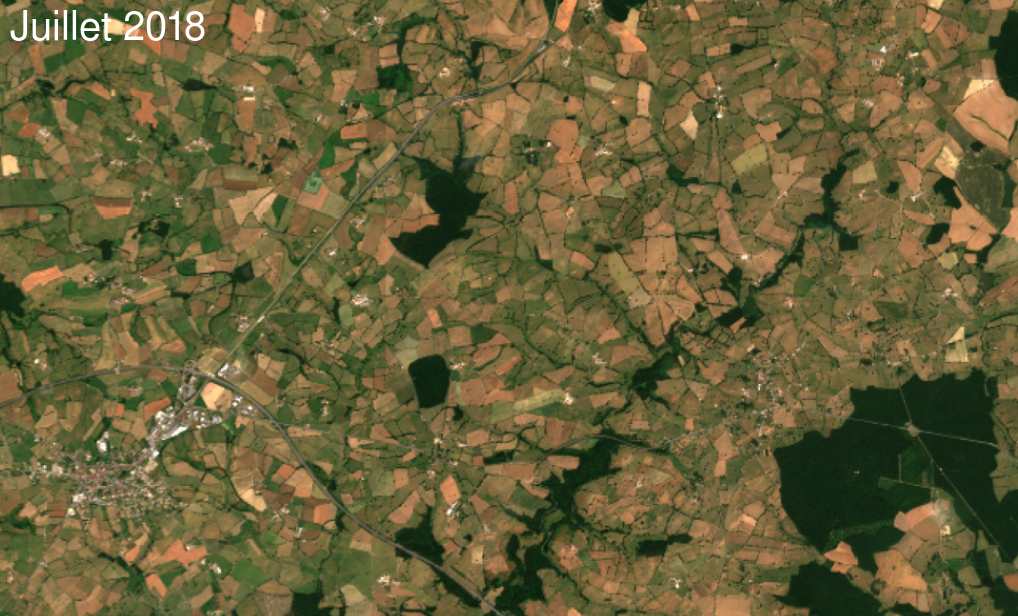 | 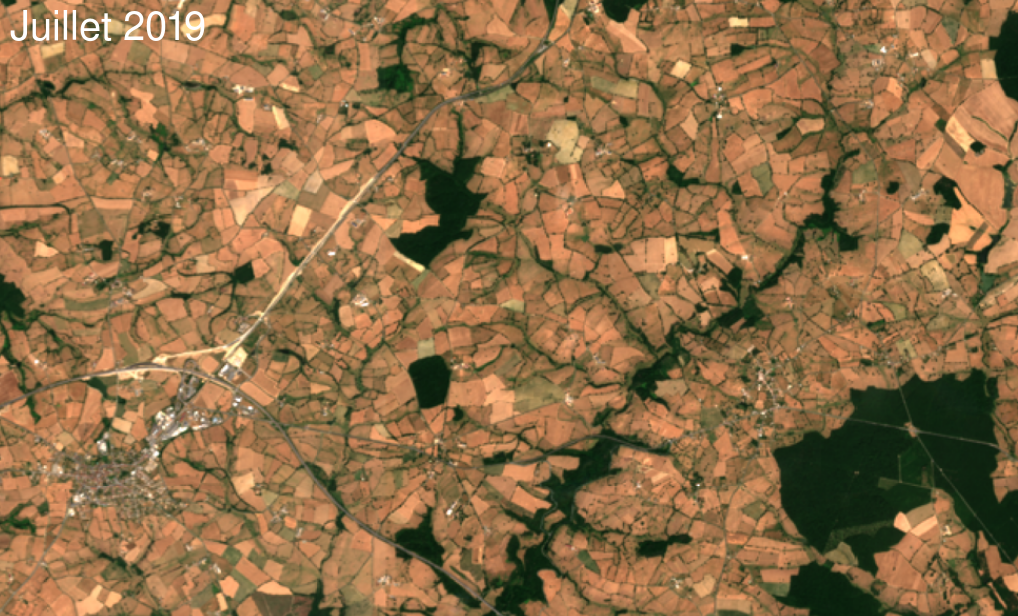 |
| July 2017 | July 2018 | July 2019 |
The full resolution data, and the corresponding data quality masks, can be downloaded from Theia’s distribution server at CNES.
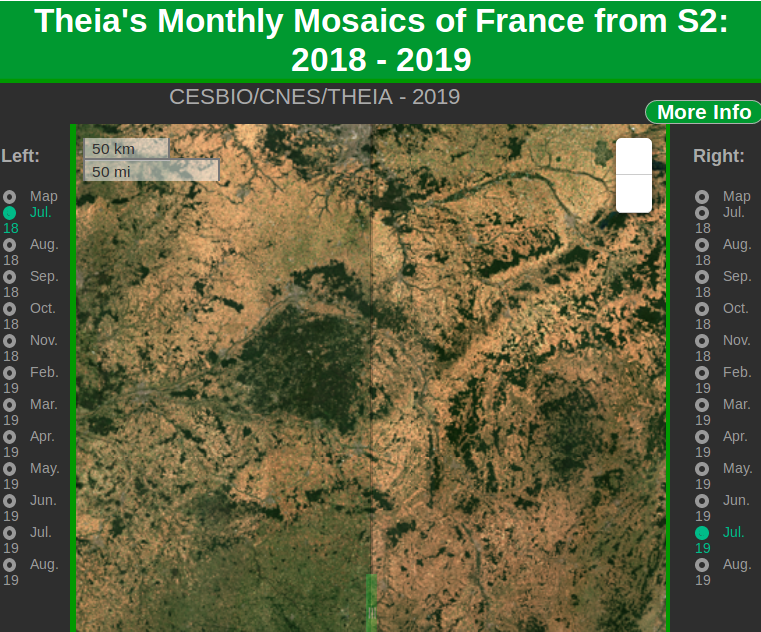
If you are not afraid to spend too much time while you have urgent things to do, you may also use the nice viewer below (merci Michel Lepage !) to compare with the previous months :
Here is how to cite this data set :
made from Sentinel-2 images from the Copernicus program of the European Union
Processed by CNES for Theia data Center, based on methods developped at CESBIO
Methodology, caveats and artefacts
The monthly syntheses are produced using the WASP processor, which is described here.. In a few words, it computes a weighted average of the cloud free surface reflectances from L2A products processed with MAJA. It is therefore very sensitive to the quality of cloud detection (which is good, thankfully).
With the average of surface reflectances, we also provide the average of the non cloudy dates. This information is important because these dates differ from place to place depending on the cloud cover of #Sentinel overpasses. As you may see on next figure, the weighted average date in July can change by 25 days depending on the regions and the Sentinel-2 orbital configuration. Neglecting this information can introduce an error of 10 to 15 days on the estimation of the pixel date.
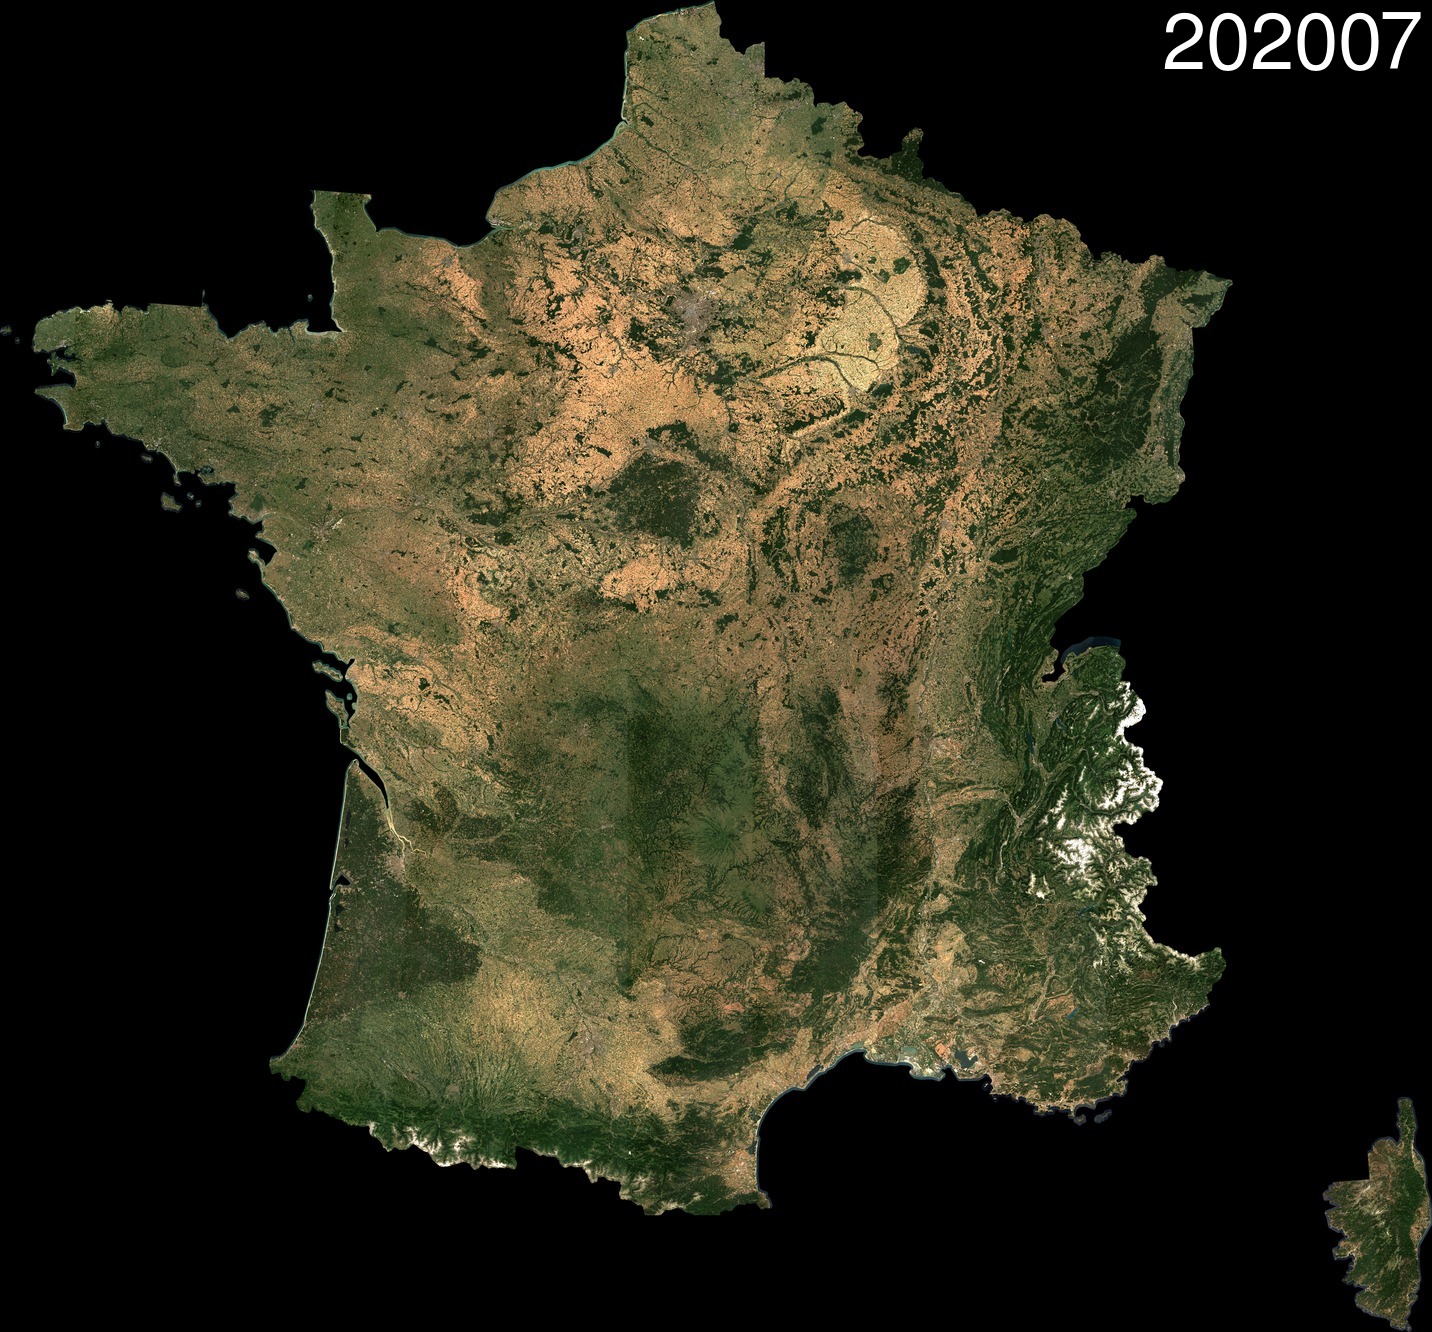 | 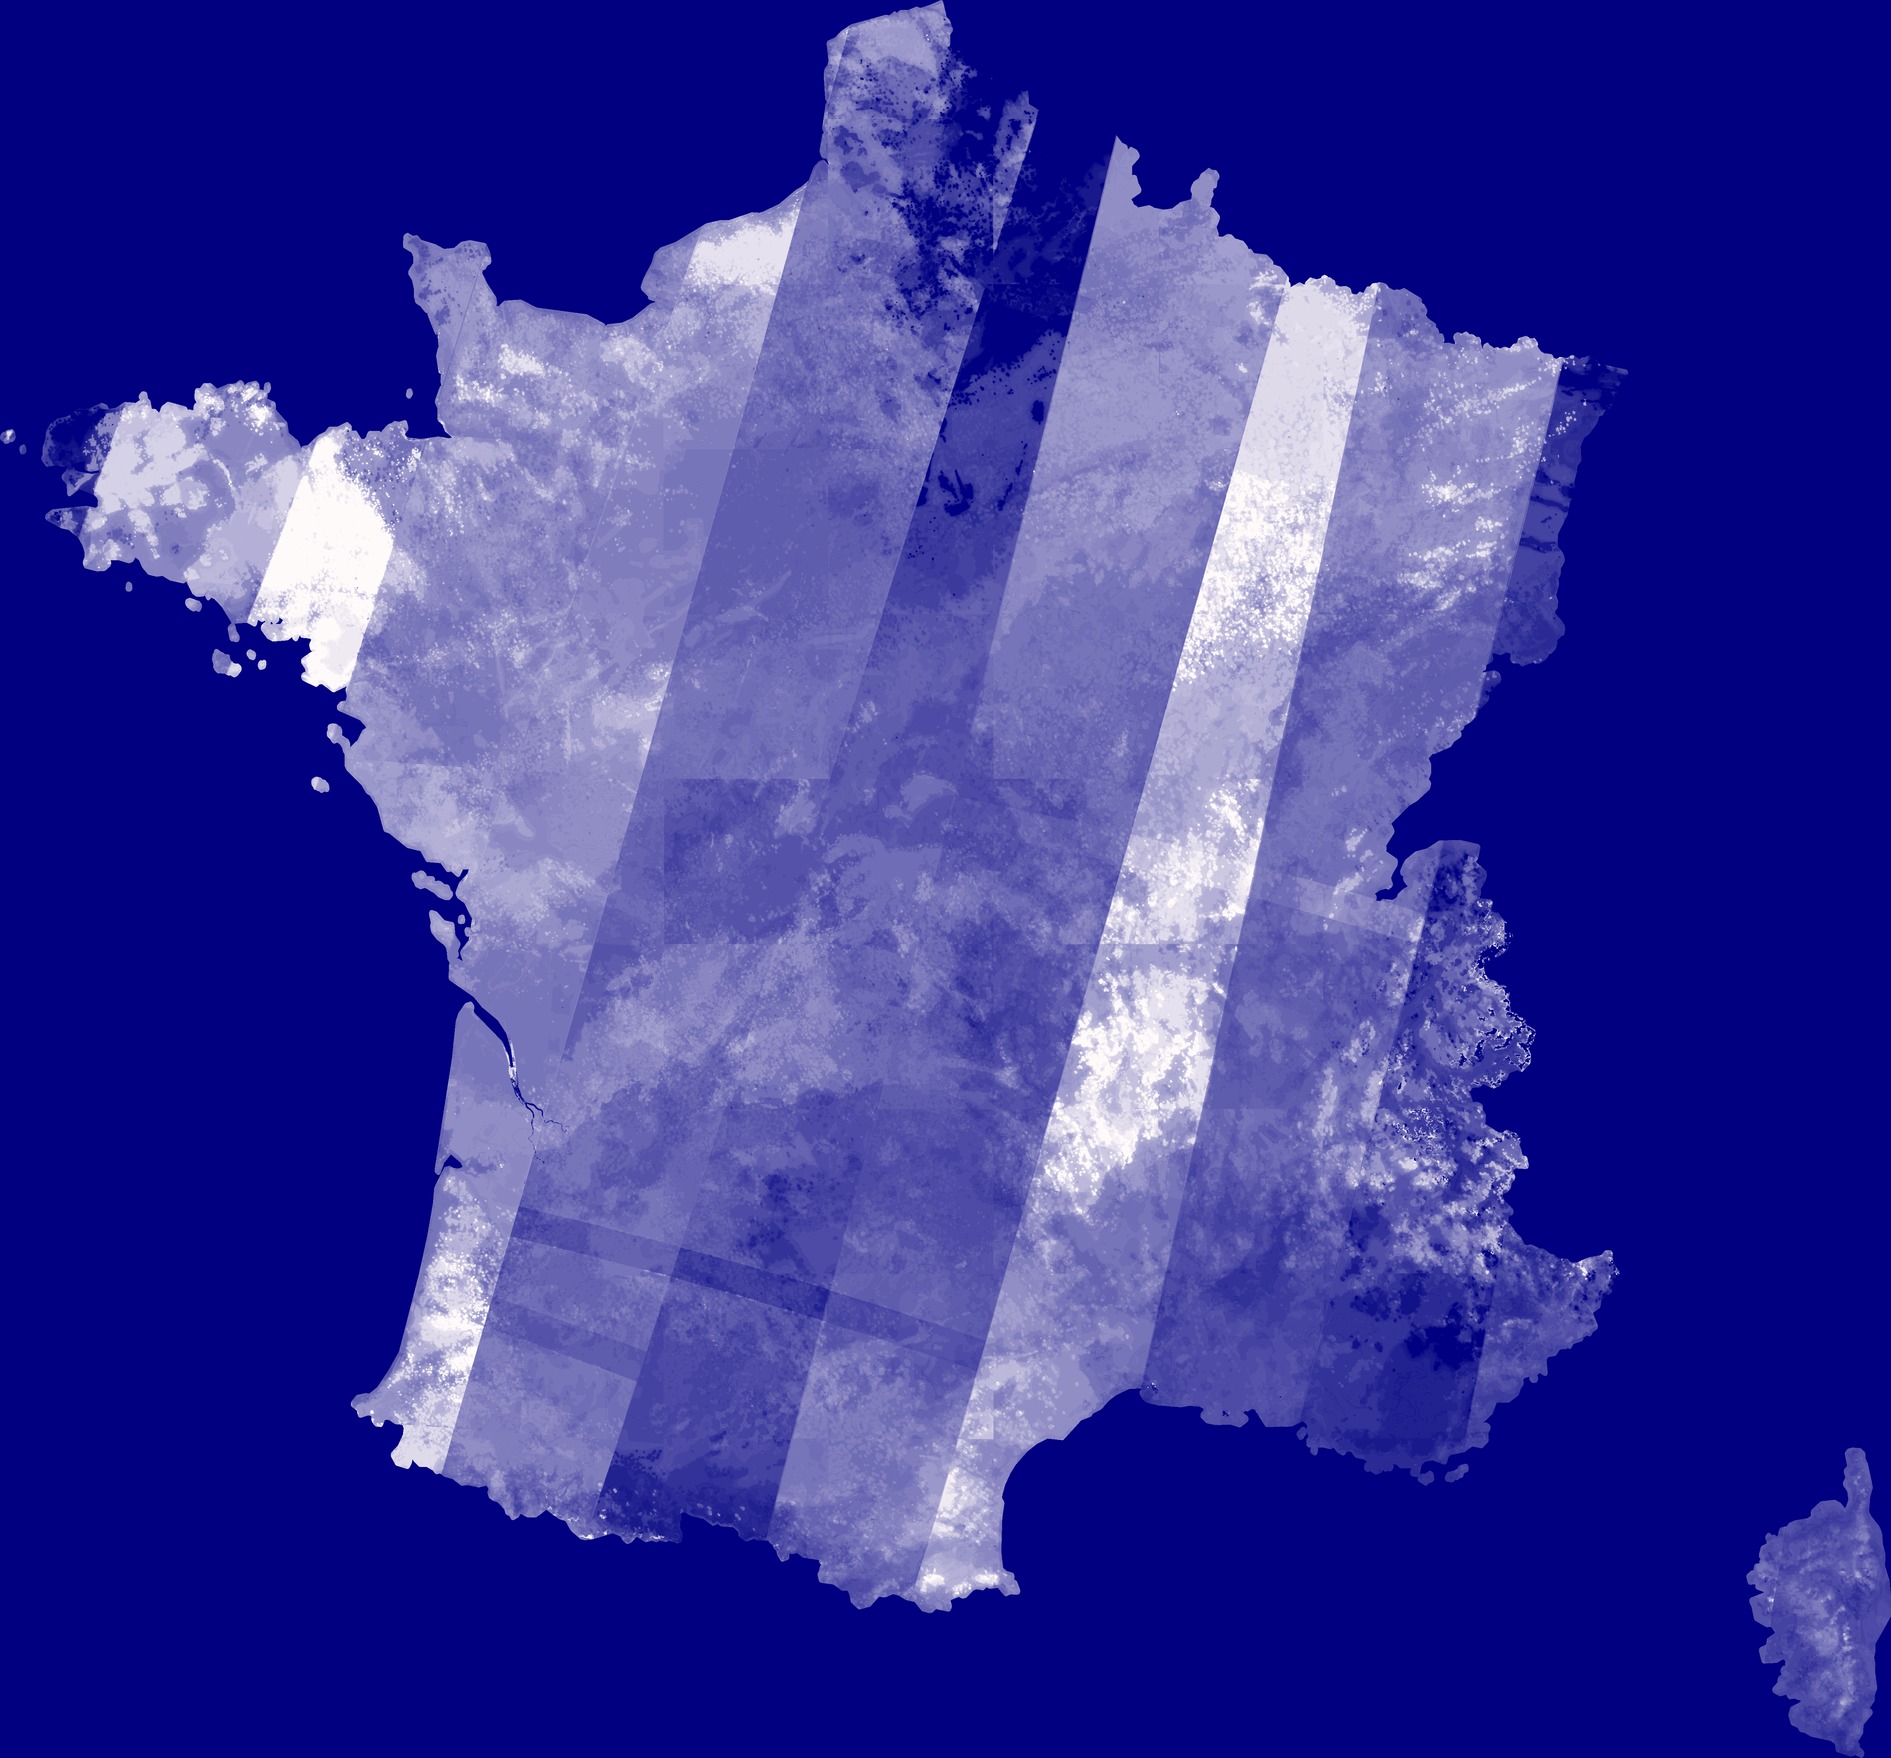 |
| July 2020 : weighted average of surface reflectances of cloud free observations | July 2020 : weighted average of the dates of cloud free observations. Blue : beginning of the month, white : End of the month. |
By comparing the various syntheses, you will see the evolution of the landscape, generally a little greener in October, but this representation will also help you spot the composite artefacts. These are not very numerous, but you will see them :
- on some web browsers (firefox V58), geometrical differences appear even at a low resolution. Other browsers and versions do not have this defect. It is really not due to Sentinel-2 or Theia products
- above water and snow (we must work on this defect)
- where clouds have covered a place during the whole synthesis period. These pixels are flagged as invalid in the products (but not on the mosaic), and for the mosaics, we provide the minimum of blue value.
- where clouds or shadows were not properly detected by MAJA
- at the edges of Sentinel-2 swath (but the effect is really faint)
- some tile edges in July, due to the fact that Level 3A products were not all generated for the 15th of July, but for dates between the 8th and the 26th. This has been corrected for August and September.
Direct acces to monthly mosaics
Each monthly synthesis is accessible using the following links :
- July 2018
- August 2018
- September 2018
- October 2018
- November 2018
- February 2019
- March 2019
- April 2019
- May 2019
- June 2019
- July 2019
- July 2020