This app shows the average concentration of airborne Nitrogen Dioxide (NO2) over the last 30 days in comparison with the same period in the previous year. The NO2 is a gas that is emitted from combustion sources, therefore changes in NO2 could reflect the economic slowdown following the outbreak of coronavirus. The NO2 concentrations were retrieved by the European Copernicus Sentinel-5P satellite. Pixels with cloud fraction higher than 25% are removed from the analysis. The app is automatically updated when new observations are available.
Click here to view in full screen.
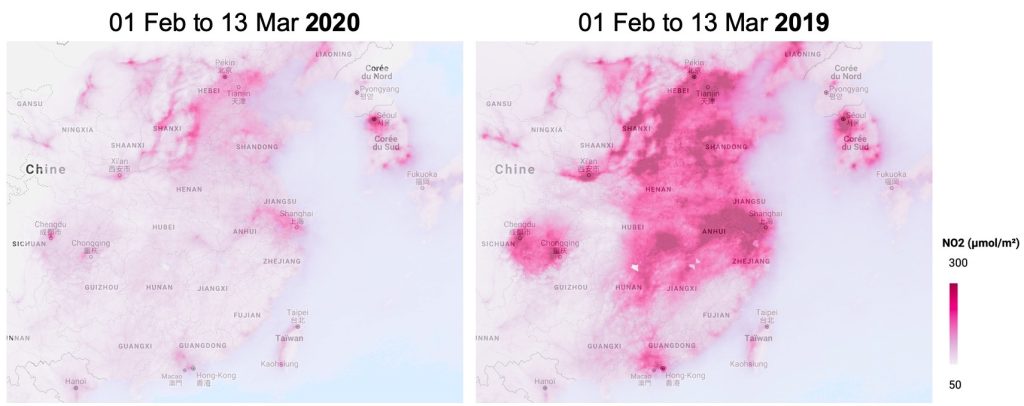
This is an example over China:
More information:
- about the dataset in the Google Earth Engine catalogue
- about the Nitrogen Dioxide and the Tropomi instrument on board Sentinel-5P
- This note on flawed estimates of the effects of lockdown measures on air quality derived from satellite observations
- Earth Engine users can get the source code here.
- A medium post on other Earth Engine apps
- this thread in Twitter
- Another great dataviz by ESA
- Analysis: Coronavirus has temporarily reduced China’s CO2 emissions by a quarter
- In this blog: Impact du coronavirus sur la qualité de l’air en Chine and China’s NO2 emissions now rising