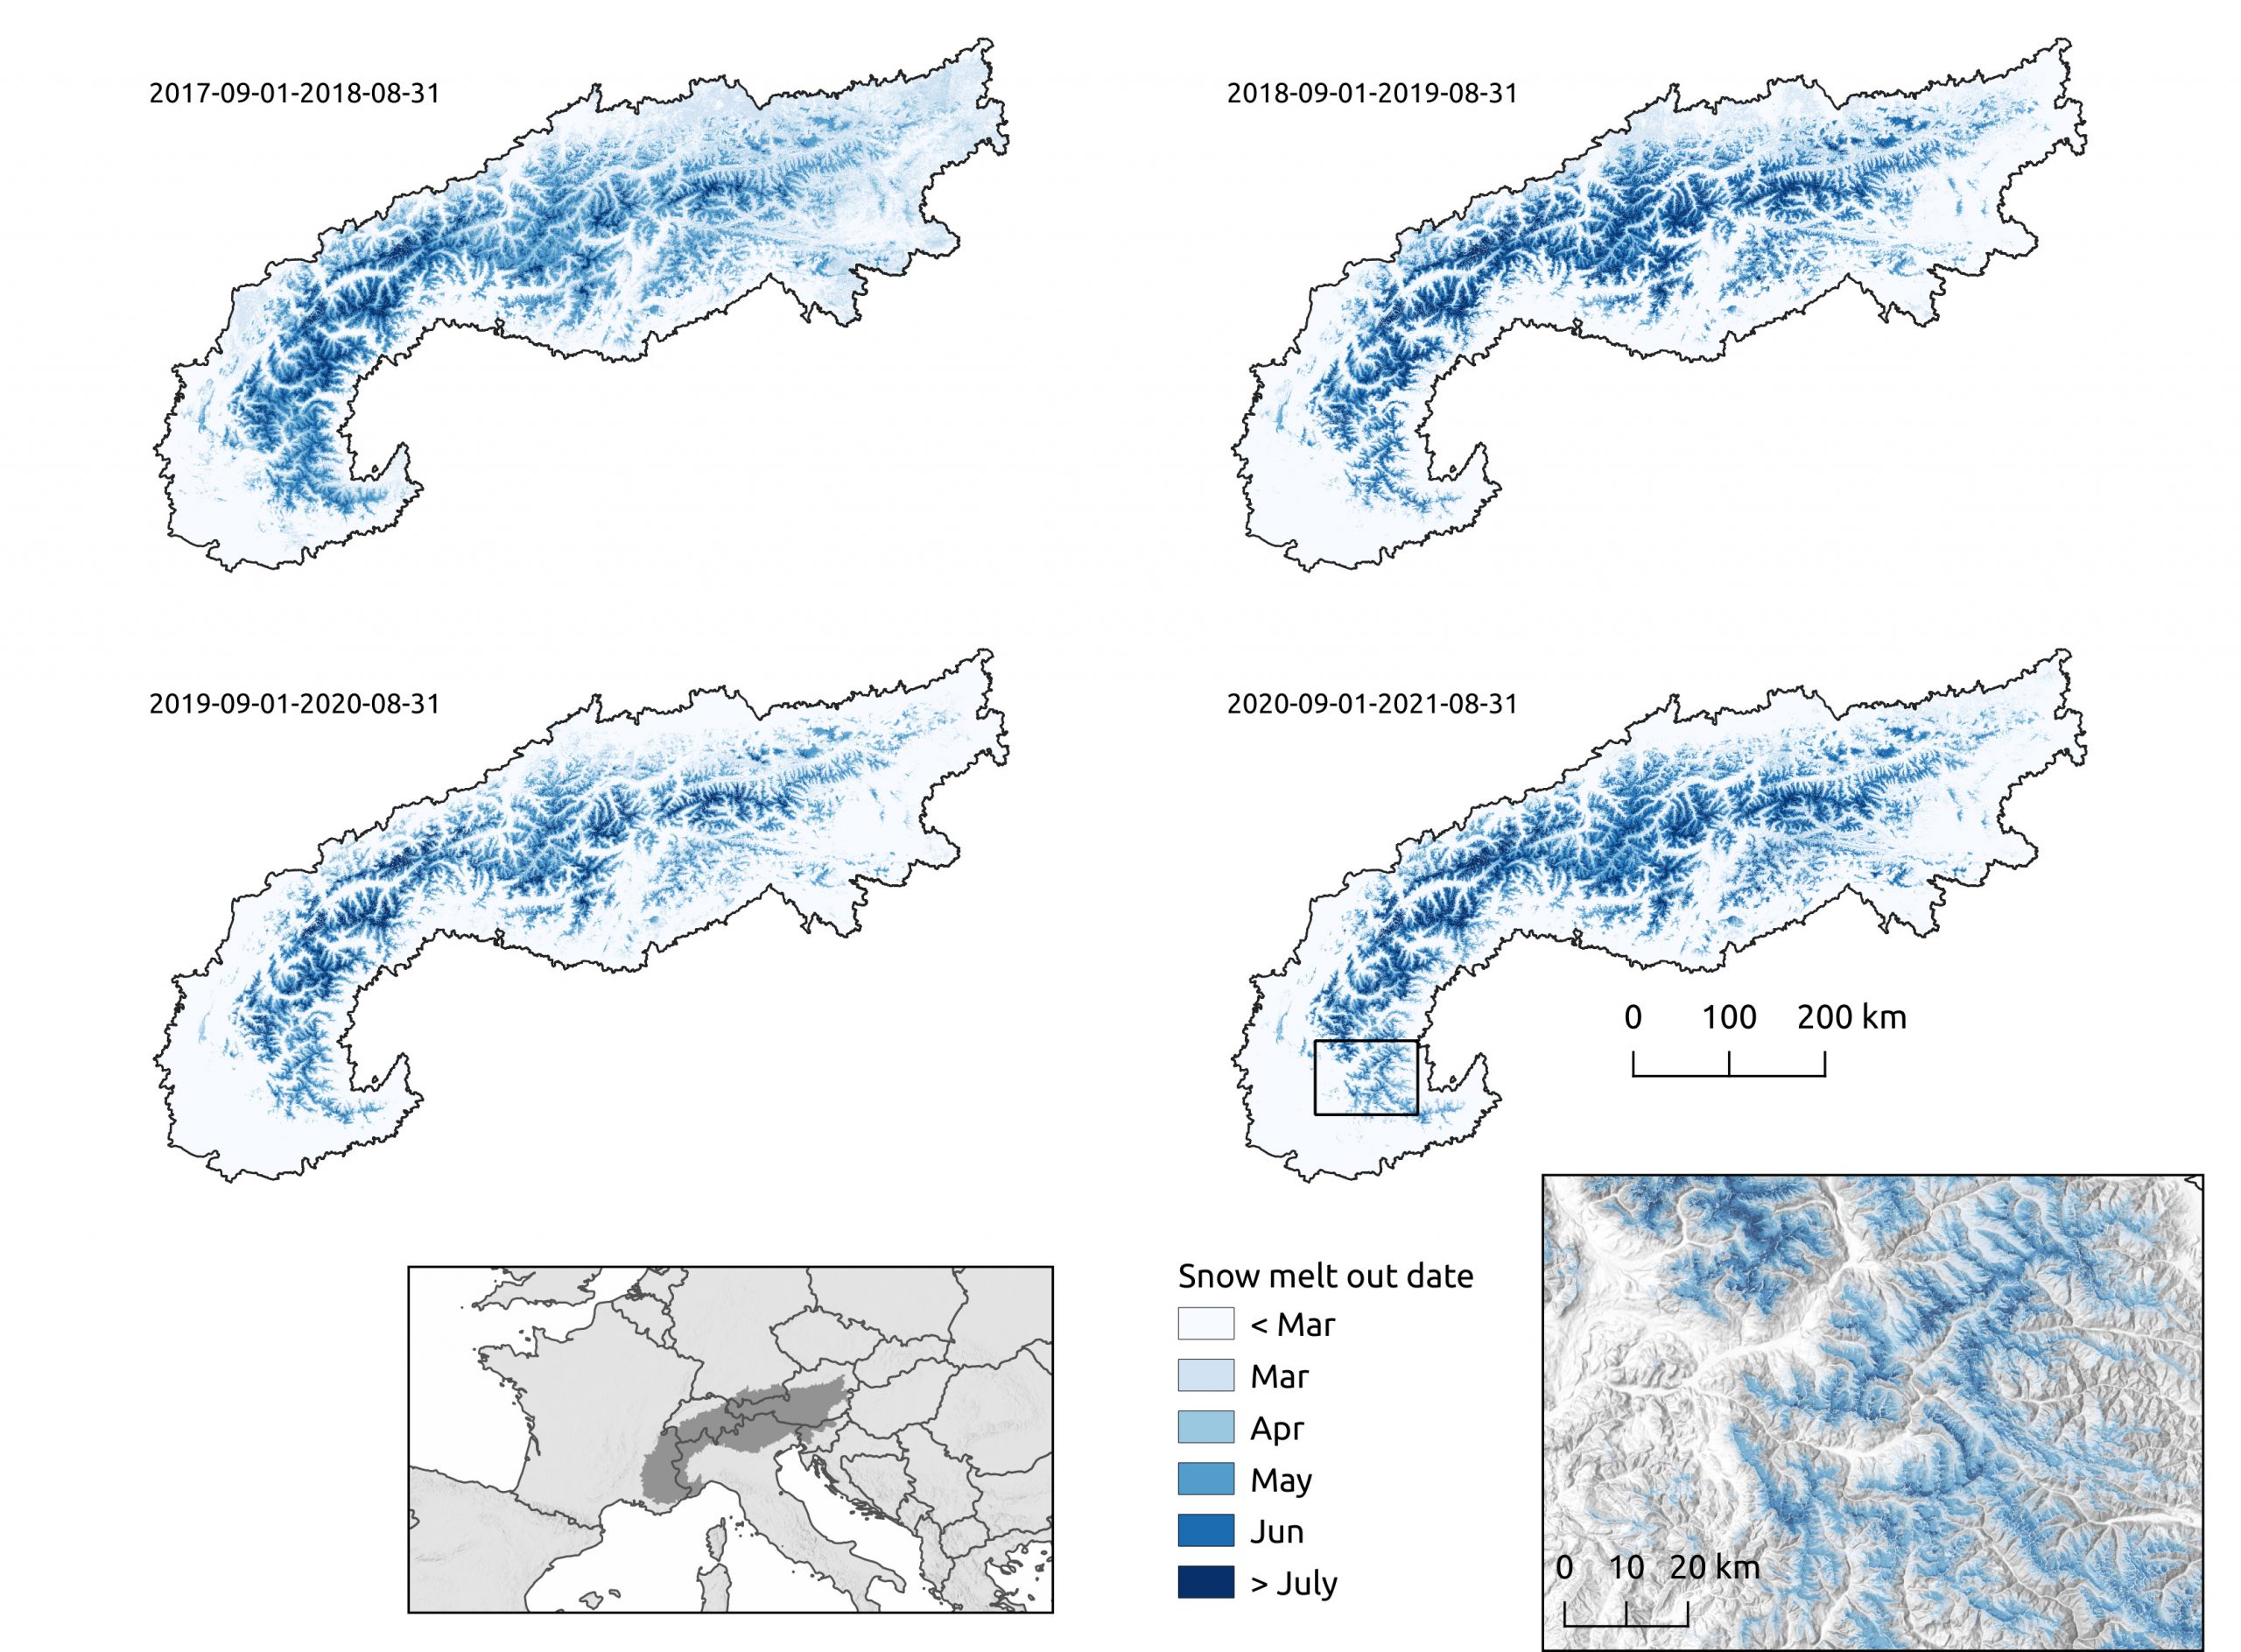
Multitemporal snow metrics from Sentinel-2
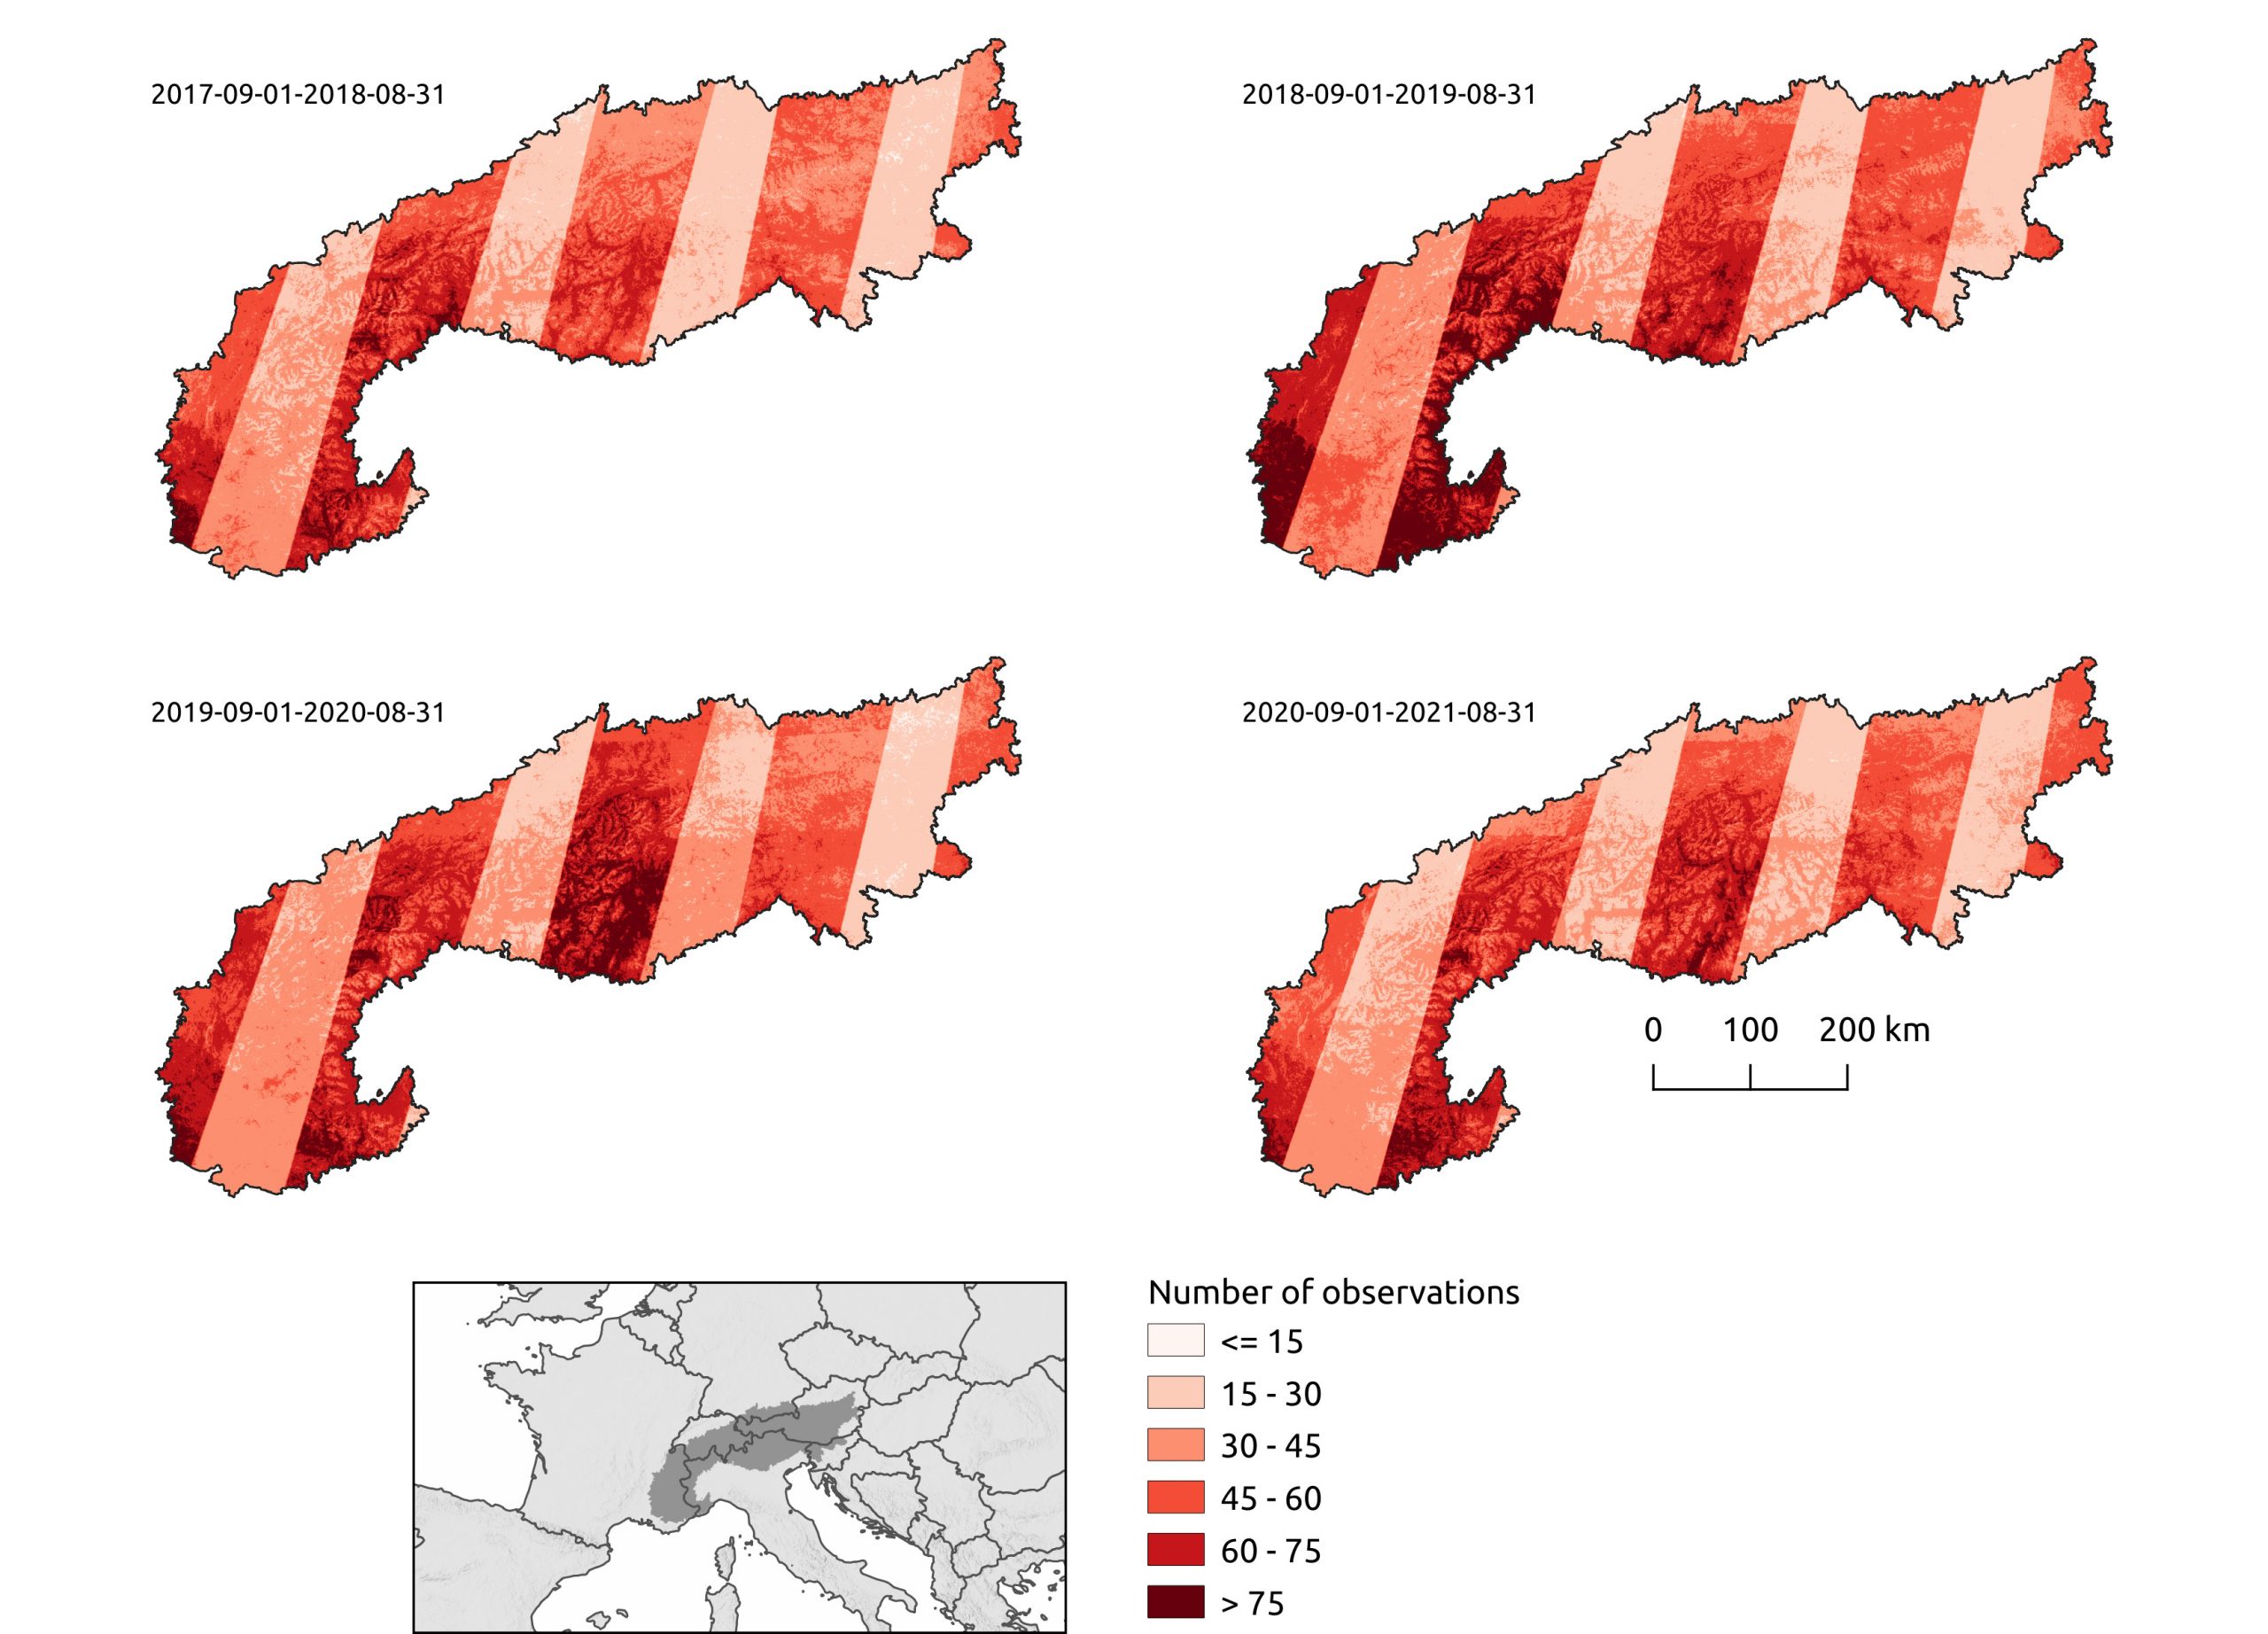
Our let-it-snow (LIS) processor computes the extent of the snow cover from Sentinel-2 surface reflectance (level 2 products). However, it can also compute multi-temporal composites (level 3 products) such as the snow cover duration, snow onset and snow melt out date from a time series of snow cover maps with a cloud mask. Aurore Dupuis (CNES) has upgraded this module to handle the snow products from the Copernicus High Resolution Snow & Ice Monitoring Service (HRSI). Since the HRSI products are generated (by MAJA and LIS as well) at pan-European scale, we are now able to generate these composites over any mountain range in Europe at 20 m resolution for the past four years. In general we consider the hydrological year as the period of aggregation, i.e. from 01 September of year N to 31 August of year N+1 (read the method).
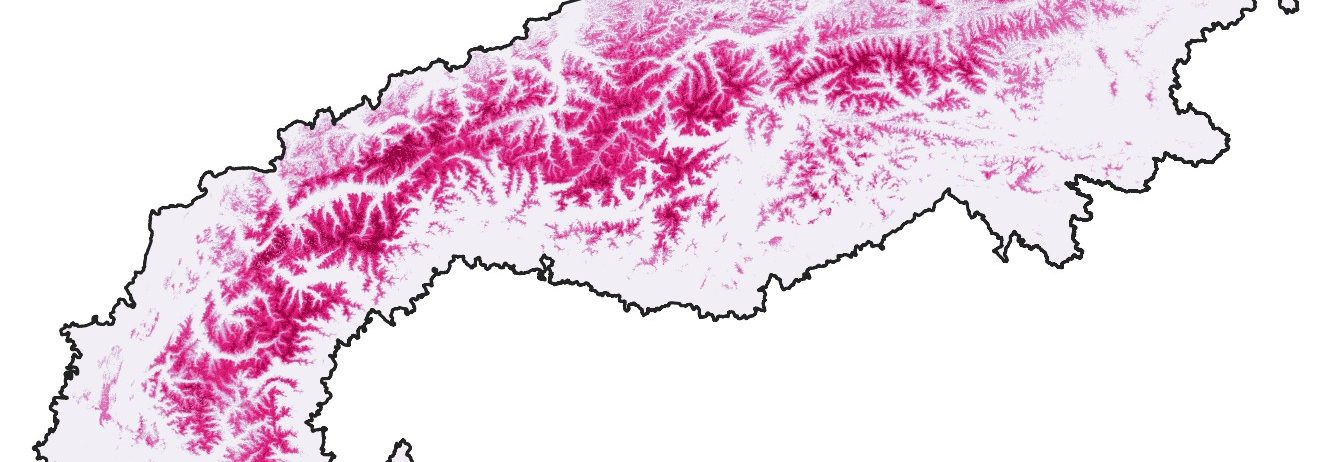
Here is an overview of the products over the Alps and a zoom near Barcelonette.
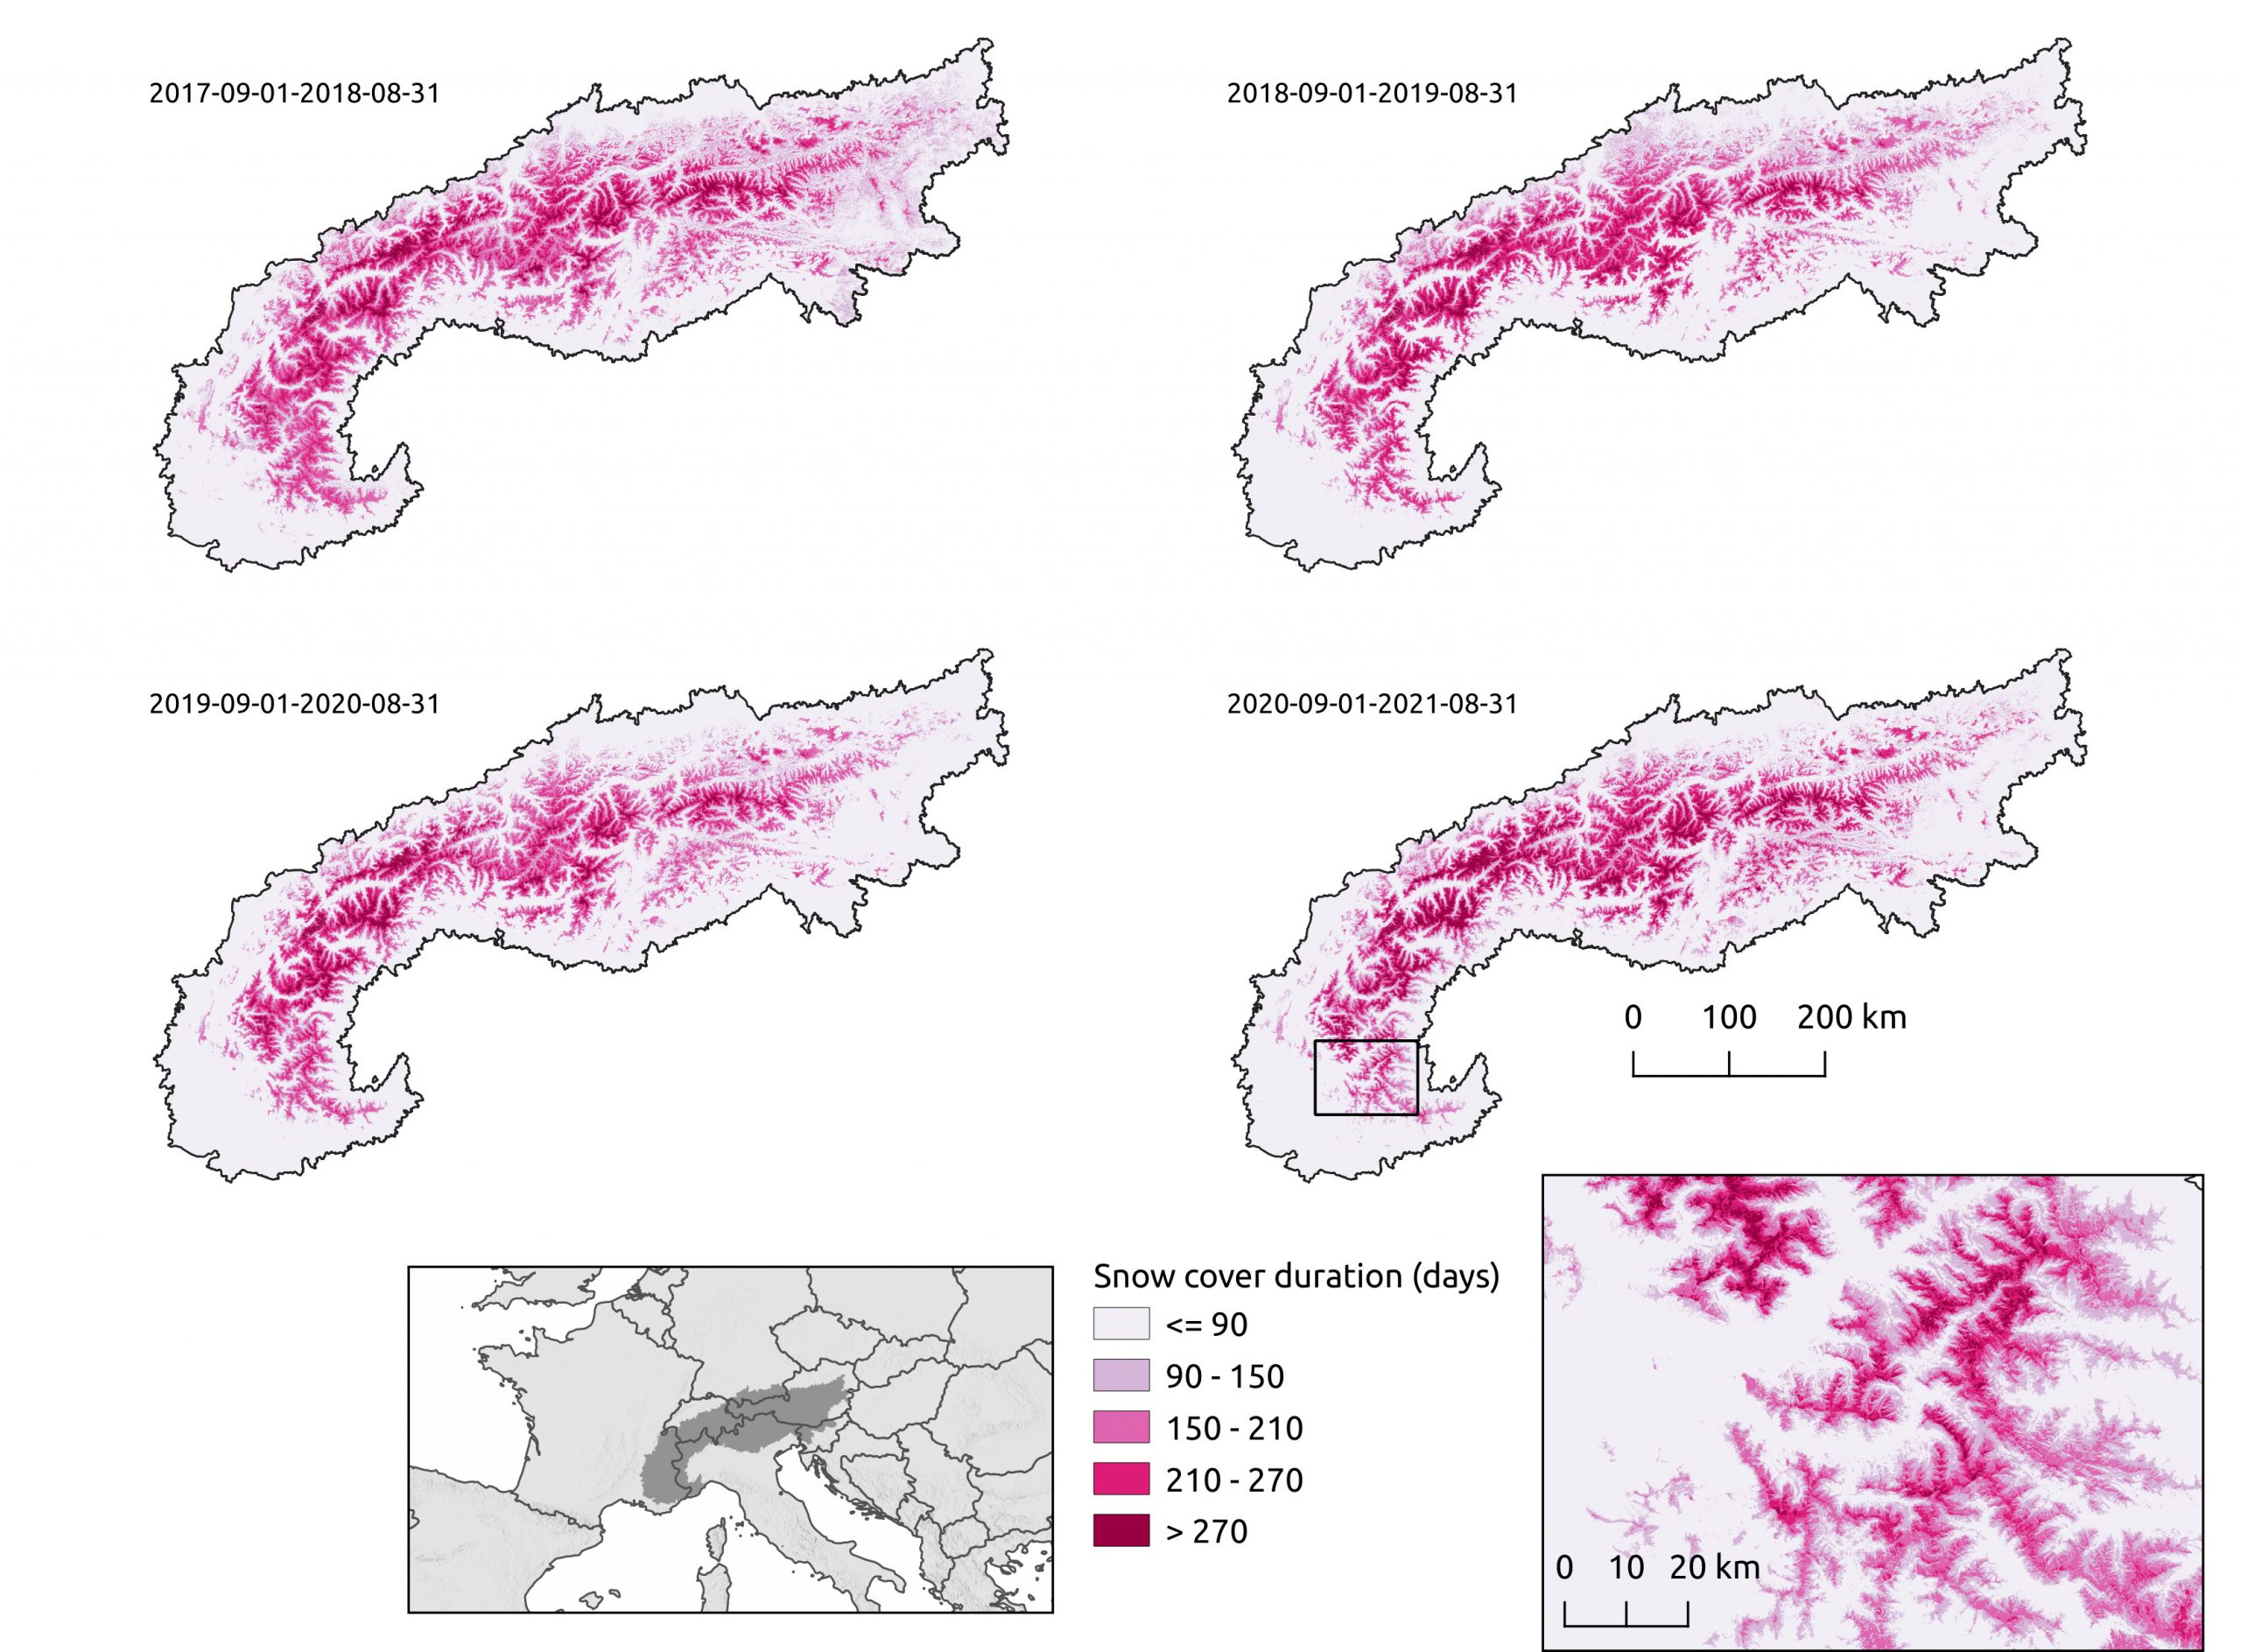
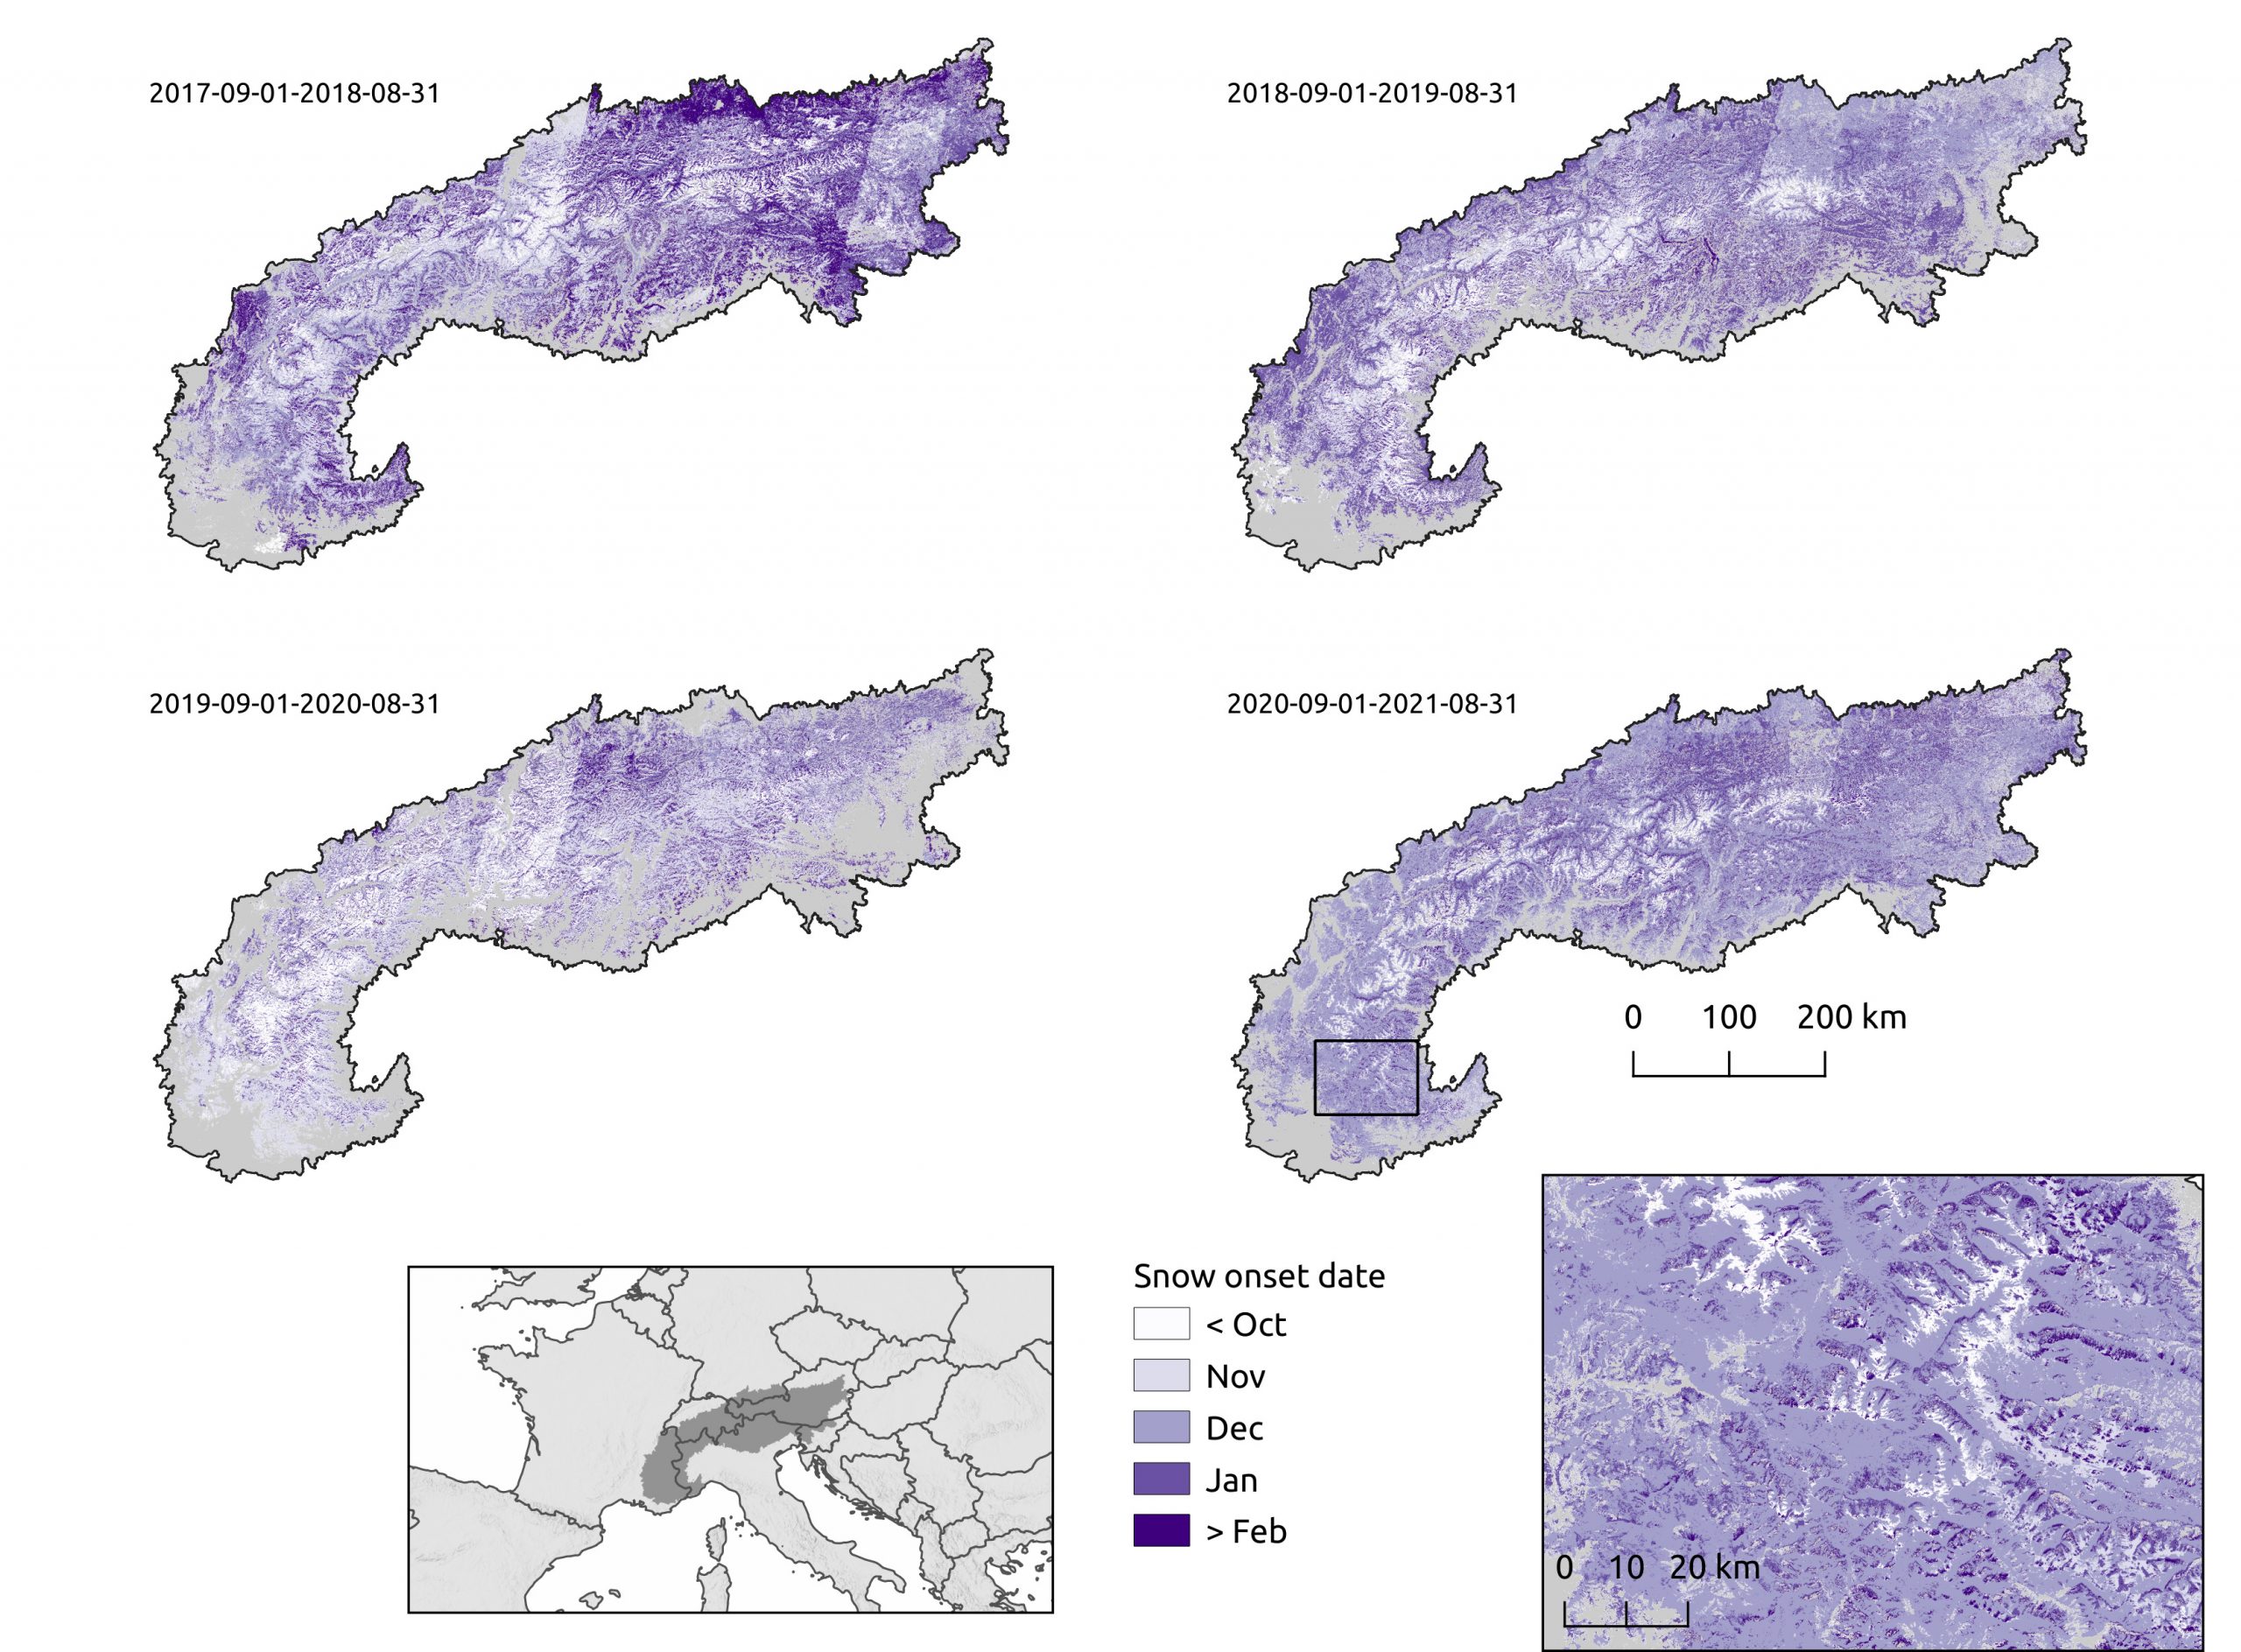
Note that the « snow onset date » is noisy and the imprint of the Sentinel-2 swath is still visible in some areas. This reflects the high sensitivity of this indicator to the observations timing. Indeed, the « snow onset date » occurs in early winter when… it’s snowing. And when it’s snowing, there are clouds in the sky hiding the land surface. The start of the snow season is therefore rarely well captured by optical sensors such as Sentinel-2 despite its revisit of 5 days.
Arthur Bayle (LECA) will use the data for an analysis of vegetation trends in the Alps in the frame of the TOP project funded by the French Research Agency. I think we can learn many things from this dataset. I already have some ideas… What would you do?