Is Antarctica greening?
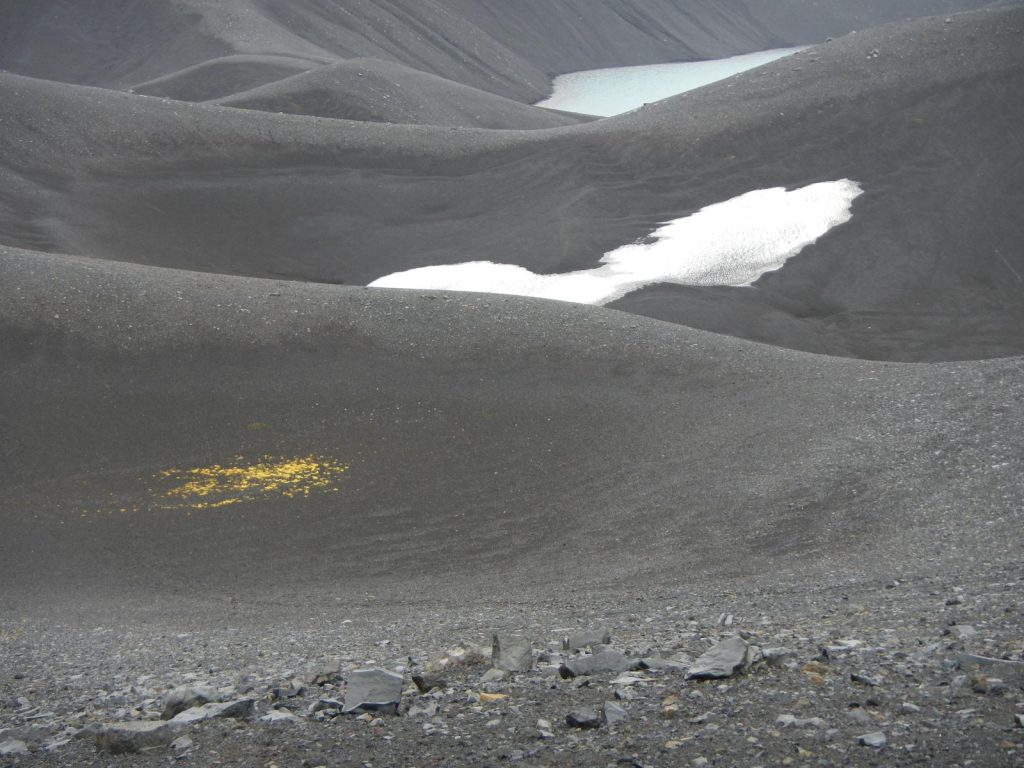
In a recent study, Roland and Bartlett et al. (2024) showed that the Antarctic Peninsula is « greening », i.e. the area covered by vegetation is growing. This article published in Nature Geoscience was featured in many media outlets. The authors drew this conclusion from the analysis of 35 years of Landsat images. More specifically, they computed a composite image of the maximum NDVI observed in March of every year since 1986. They used this annual time series to study the evolution of the area exceeding an NDVI threshold of 0.2. I was skeptical about the results because we showed recently that greening trends derived from annual maximum NDVI can be overestimated because the number of available Landsat observations increases over time (Bayle et al. 2024).
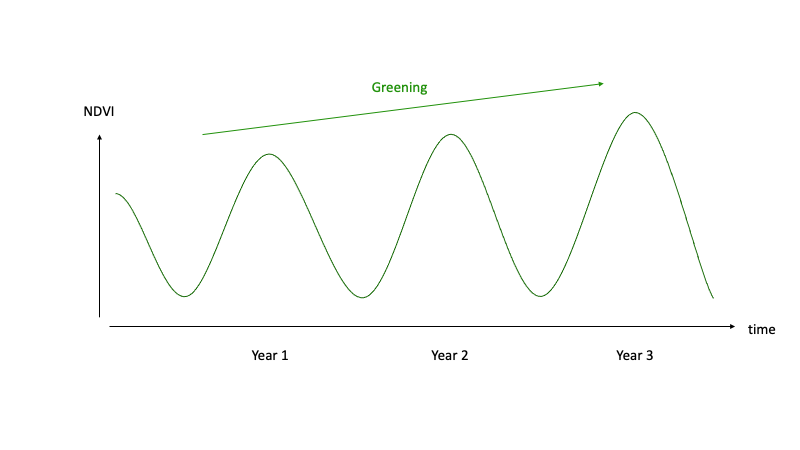
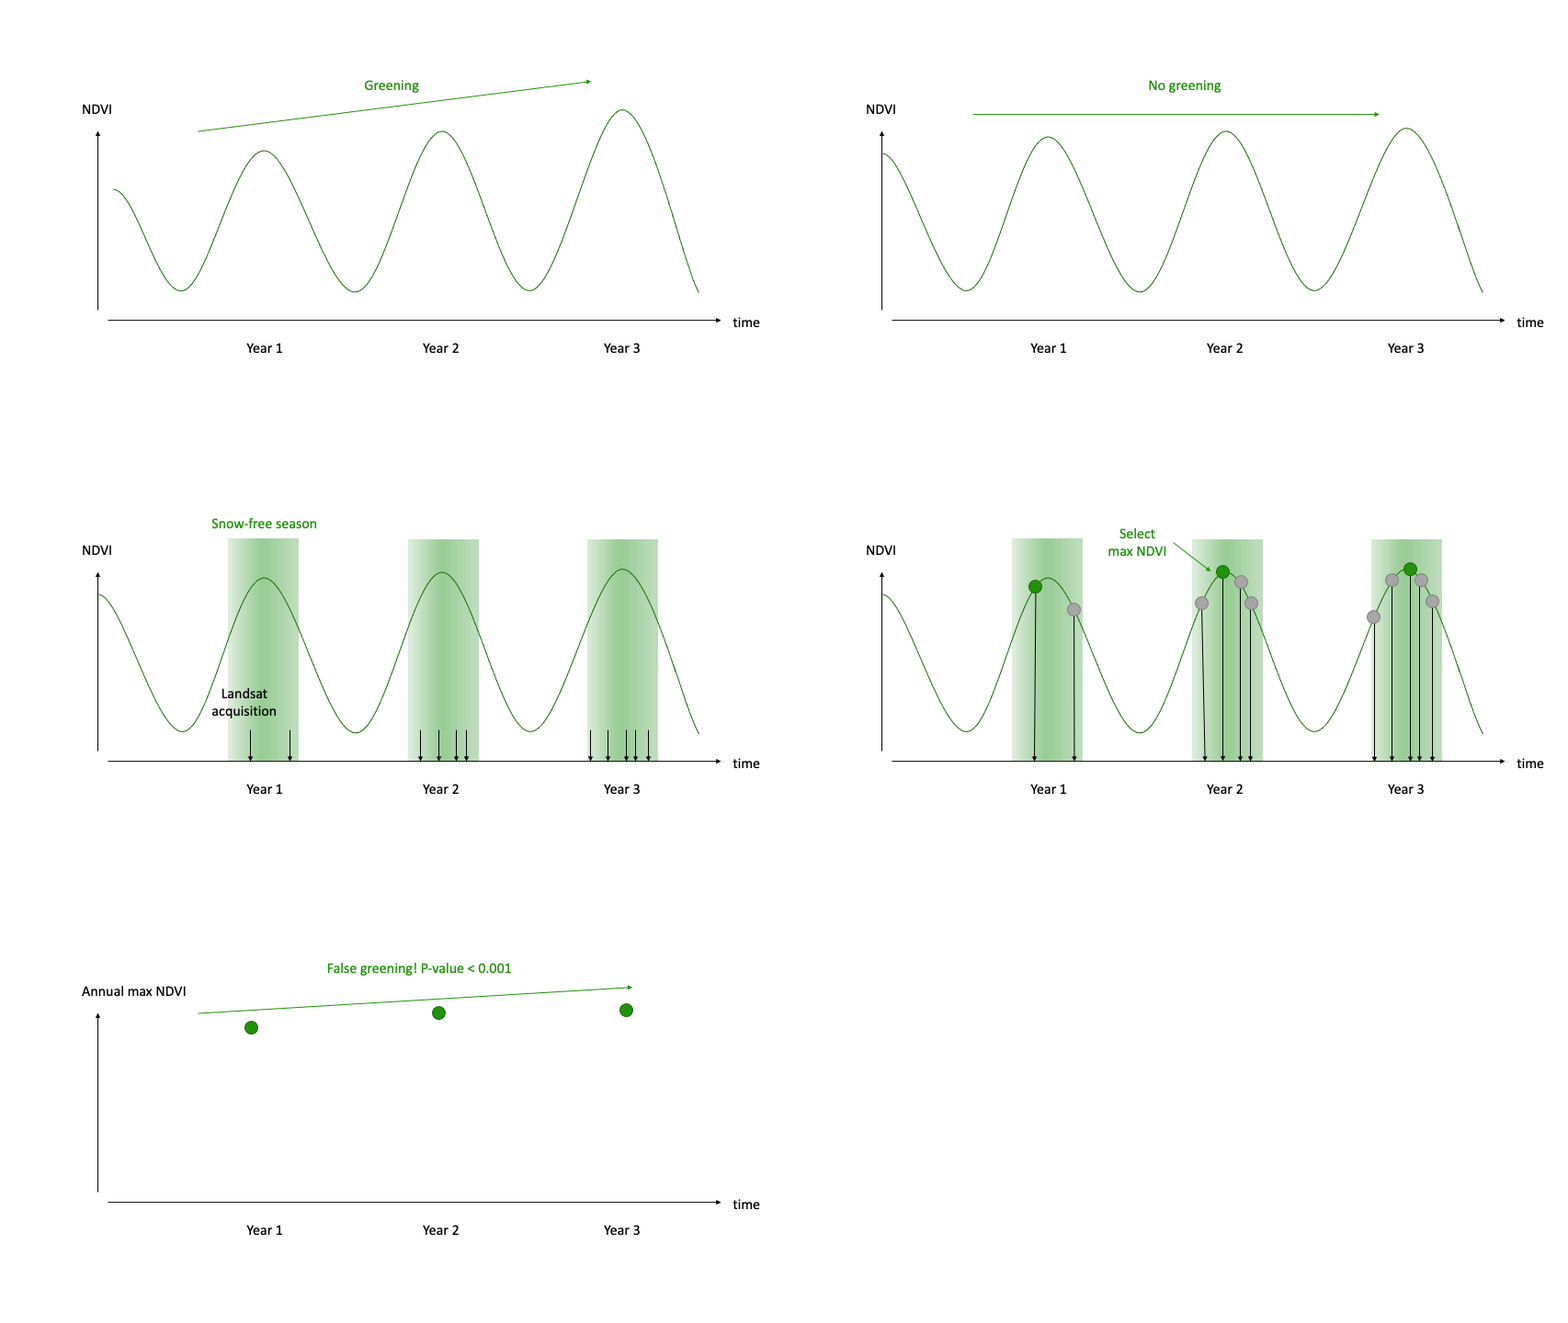
In temperate and sub-polar regions, the NDVI time series at a Landsat pixel is expected to look like this if there is a « greening ».

Such time series can be easily generated in Google Earth Engine from images acquired by Landsat 5, 7 and 8. A single line of code creates a global collection of Landsat images spanning the past 40 years!
var Landsat = ee.ImageCollection('LANDSAT/LC08/C02/T2_TOA')
    .merge(ee.ImageCollection('LANDSAT/LE07/C02/T2_TOA'))
    .merge(ee.ImageCollection('LANDSAT/LT05/C02/T2_TOA'))
However, the effective revisit frequency of Landsat has substantially increased over this period, which means that more clear-sky observations are generally available in the end of the study period. As a result, it is more likely to observe an NDVI value that is close to the actual maximum in the end of the study period. This statistical artefact can lead to the false conclusion that a pixel is « greening ». It can also lead to overestimate the actual NDVI increase in greening areas. For example, Bayle et al. (2024) showed that up to 50% of the greening trend in high-elevation alpine grasslands computed by Rumpf et al. (2022) can be explained by this effect.

It is possible to check if the magnitude of the greening was also overestimated in this Antarctic Peninsula study, because the authors have shared their code. I could reproduce their calculations using the mean instead of the maximum to create the annual composite from March NDVI images. Unlike the maximum, the sample mean is an unbiased estimator of the actual mean of the data. Therefore, it should not lead to a systematic under- or overestimation of the mean NDVI depending on the number of samples.

I found that their results are robust and mostly insensitive to the changes in revisit. The main conclusion of the paper, « a clear but nonlinear trend towards a greater area of vegetation cover » remains unquestionable from this point of view. The Mann-Kendall tests yield similar results with both approaches (mean vs. max.). The main differences are related to the area changes by period (cf. supplement Tab. 5.1 in R24). The change from 1986 to 2021 is 2.30 km² per decade using the mean NDVI whereas it is 3.13 km² per decade using the max NDVI (the value quoted the paper is 3.17 km² per decade*). The low impact of the revisit in this case is probably due to the fact that the authors restricted their analysis to a very short period of time (1 month), therefore on average there is only one available observation to create the annual NDVI composite even in the end of the study period. The magnitude of the area change might be somewhat overestimated but it is difficult to give a more accurate estimate given the available data.
Area change in km2/decade
| method | maxNDVI | meanNDVI |
|---|---|---|
| 1986-2021 | 3.13 | 2.30 |
| 1986-2004 | 2.77 | 2.32 |
| 2004-2016 | 2.94 | 3.61 |
| 2016-2021 | 4.91 | -0.93 |
More details about my analysis and how to reproduce it in this repository: https://github.com/sgascoin/antarcticGreening.
* I could not find the exact same values as the authors in most of the cases, a possible explanation is given by the authors « Due to changes applied to imagery in the compilation of LANDSAT collection 2, this code cannot gaurantee exact reproduction of identical results to the paper, though the overall trends observed are highly comparable. »

References


