Kyrgyzstan glacier collapse. New Pléiades and SPOT7 images tell us more…
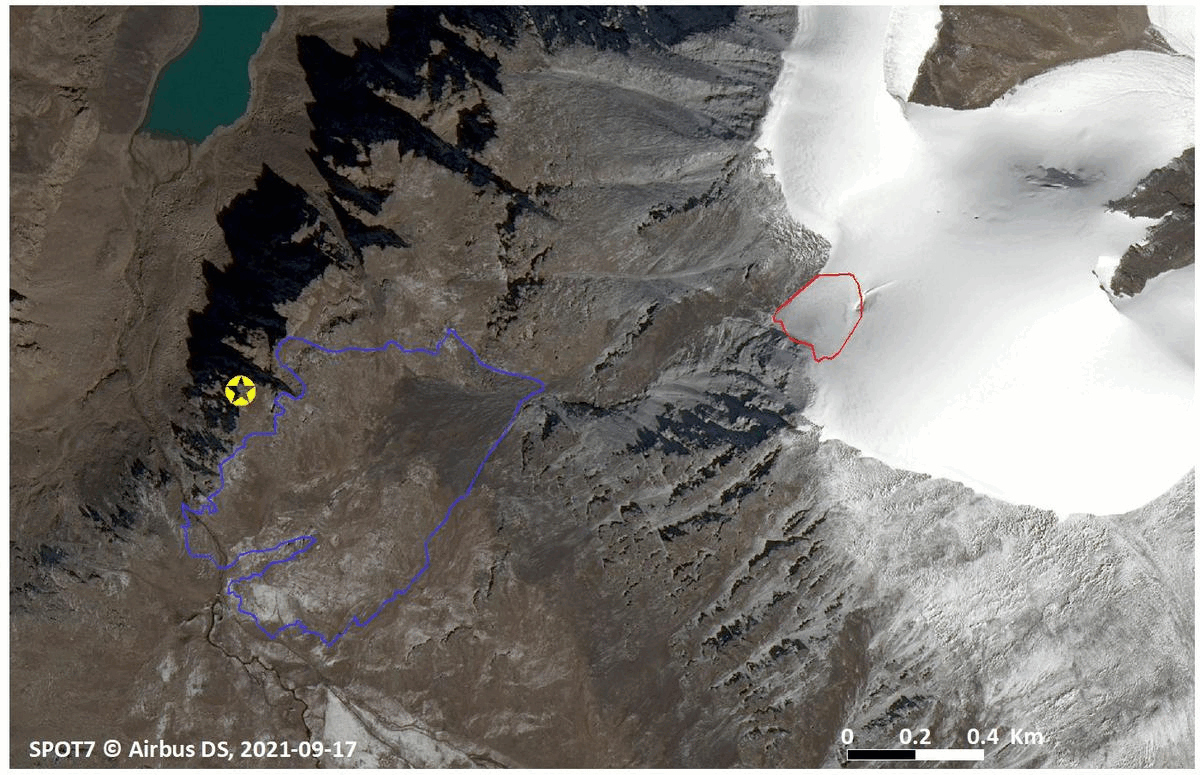
Because the first images were partly cloudy, the Pléiades 1A and 1B satellites (CNES/Airbus) continued to acquire images over Kyrgyzstan and a cloud-free 0.7-m stereoscopic pair was acquired 16 July 2022. We could also obtain a 1.5 m SPOT7 stereoscopic pair from the Airbus DS archive thanks to the Dinamis initiative. The latter was taken 17 September 2021, 10 months before the collapse.
With these new digital elevation models (DEM), we can refine our initial estimate of the ice volume that collapsed. We can also map the area covered by the deposit, a mixture of rock, ice and snow.
The detached volume is 1 145 000 m^3 originating from an area of 0.04 km² (in red). Over the 0.52 km² deposit area (in blue), the mean elevation is +1.56 m, which is equivalent to a deposited volume of 815 000 m^3 (330 000 m^3 less than the original release).
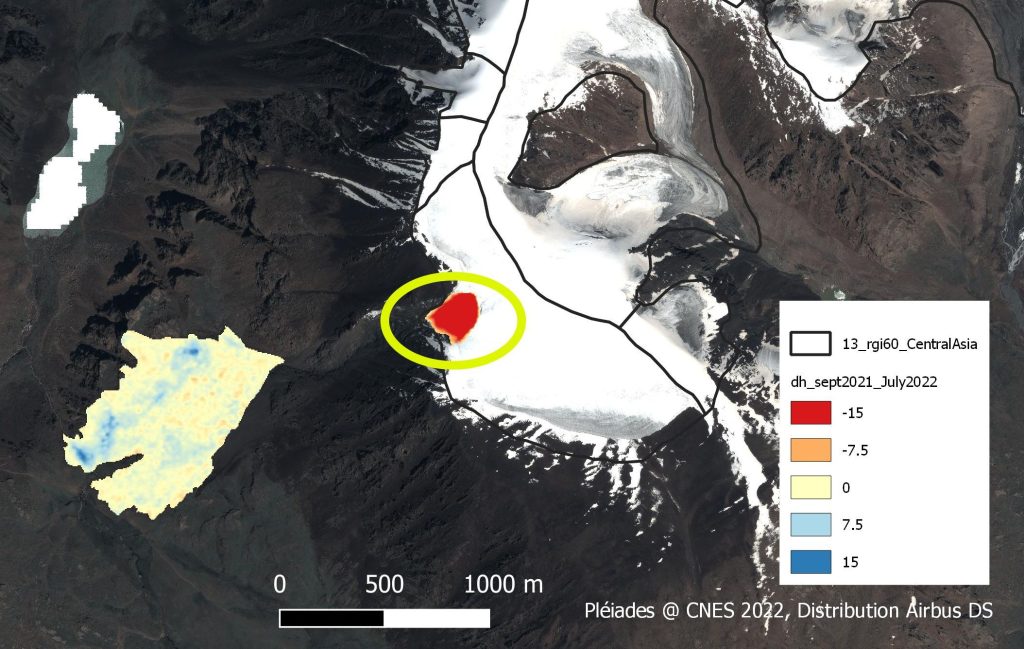
Why these two numbers do not match? The volume difference (330 000 m^3) is equivalent to an elevation drop of 0.6 m spread over the 0.5 km² deposit area. There are several possible explanations for that. Among others:
1. We expect uncertainties of typically 1 to 2 m on the elevation change measurements derived from such sensors (Pléiades and SPOT7). This may seem a lot compared to the signal but we also know that the error is reduced after averaging over the 0.5 km² area, typically down to +/- 0.4 m using the same data (Hugonnet et al., 2022)
2. A part of the difference can be due to melt of the snow/ice deposits between July 9 and July 16. 10 cm per day is high but not impossible. Check the real time ablation measurements by our Swiss colleagues.
The current #heatwave directly affects the melt rate of alpine #glaciers. On #Findelgletscher, the daily cumulative mass balance at our #holfuy station has exceeded its summer average of 2019-2021 (red line ⬇️) for 7 days in a row now! 😨#glacierselfiestick #glaciermelt pic.twitter.com/PAxLA4I4J0
— VAW Glaciology (@VAW_glaciology) July 21, 2022
3. The SPOT7 images were acquired in September 2021. This is closer in time to the event that the Copernicus 30 DEM that we used in our earlier, preliminary assessment. Still the glacier has changed between 17 September 2021 and 9 July 2022 and we do not know by how much.
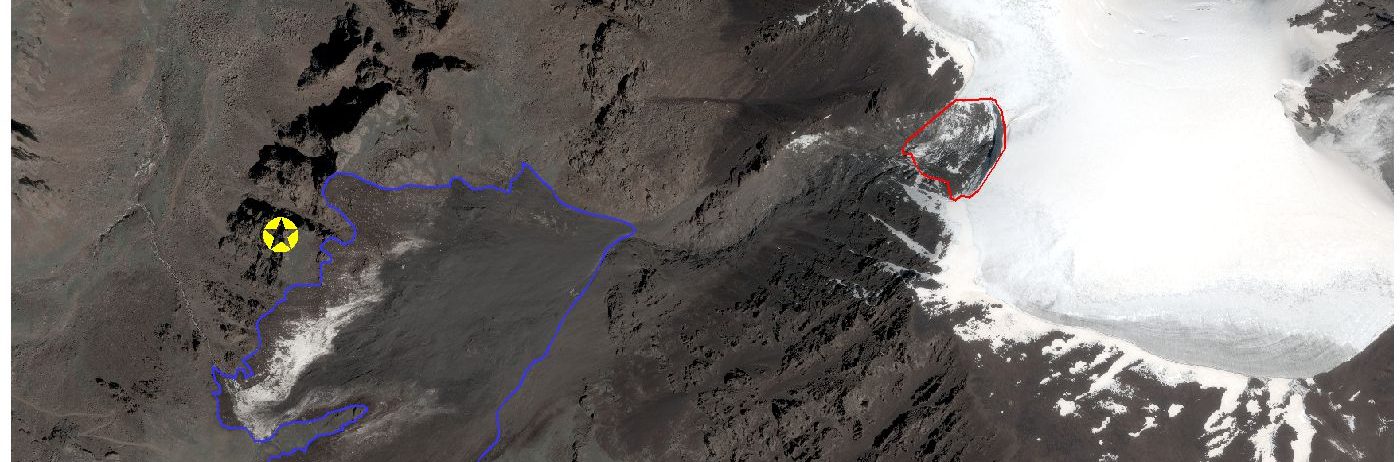
Bonus 1: The yellow star in our image animation is the location of « Survivor » Harry Shimmin when he took his viral video estimated by @brechtcastel.
This is the closest I got: 41.948877356825875 77.83925934703564 👇
— Brecht Castel (@brechtcastel) July 21, 2022
To quote Millis' tutorial: "it takes a lot of patience to play with the points to the nearest location" and "this is a long process and sometimes can be […] exhausting, but one picture is worth millions!" 14/. pic.twitter.com/Xa2iXB7m6k
Great first guess! It seems to us that the position is slightly off, as this location is not covered by debris on 16 July. Or did it entirely melt away in 7 days?
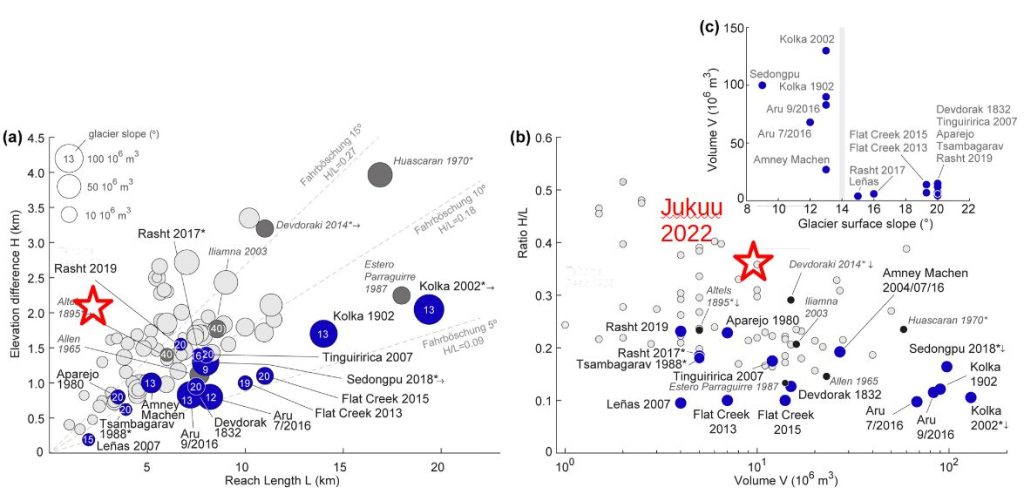
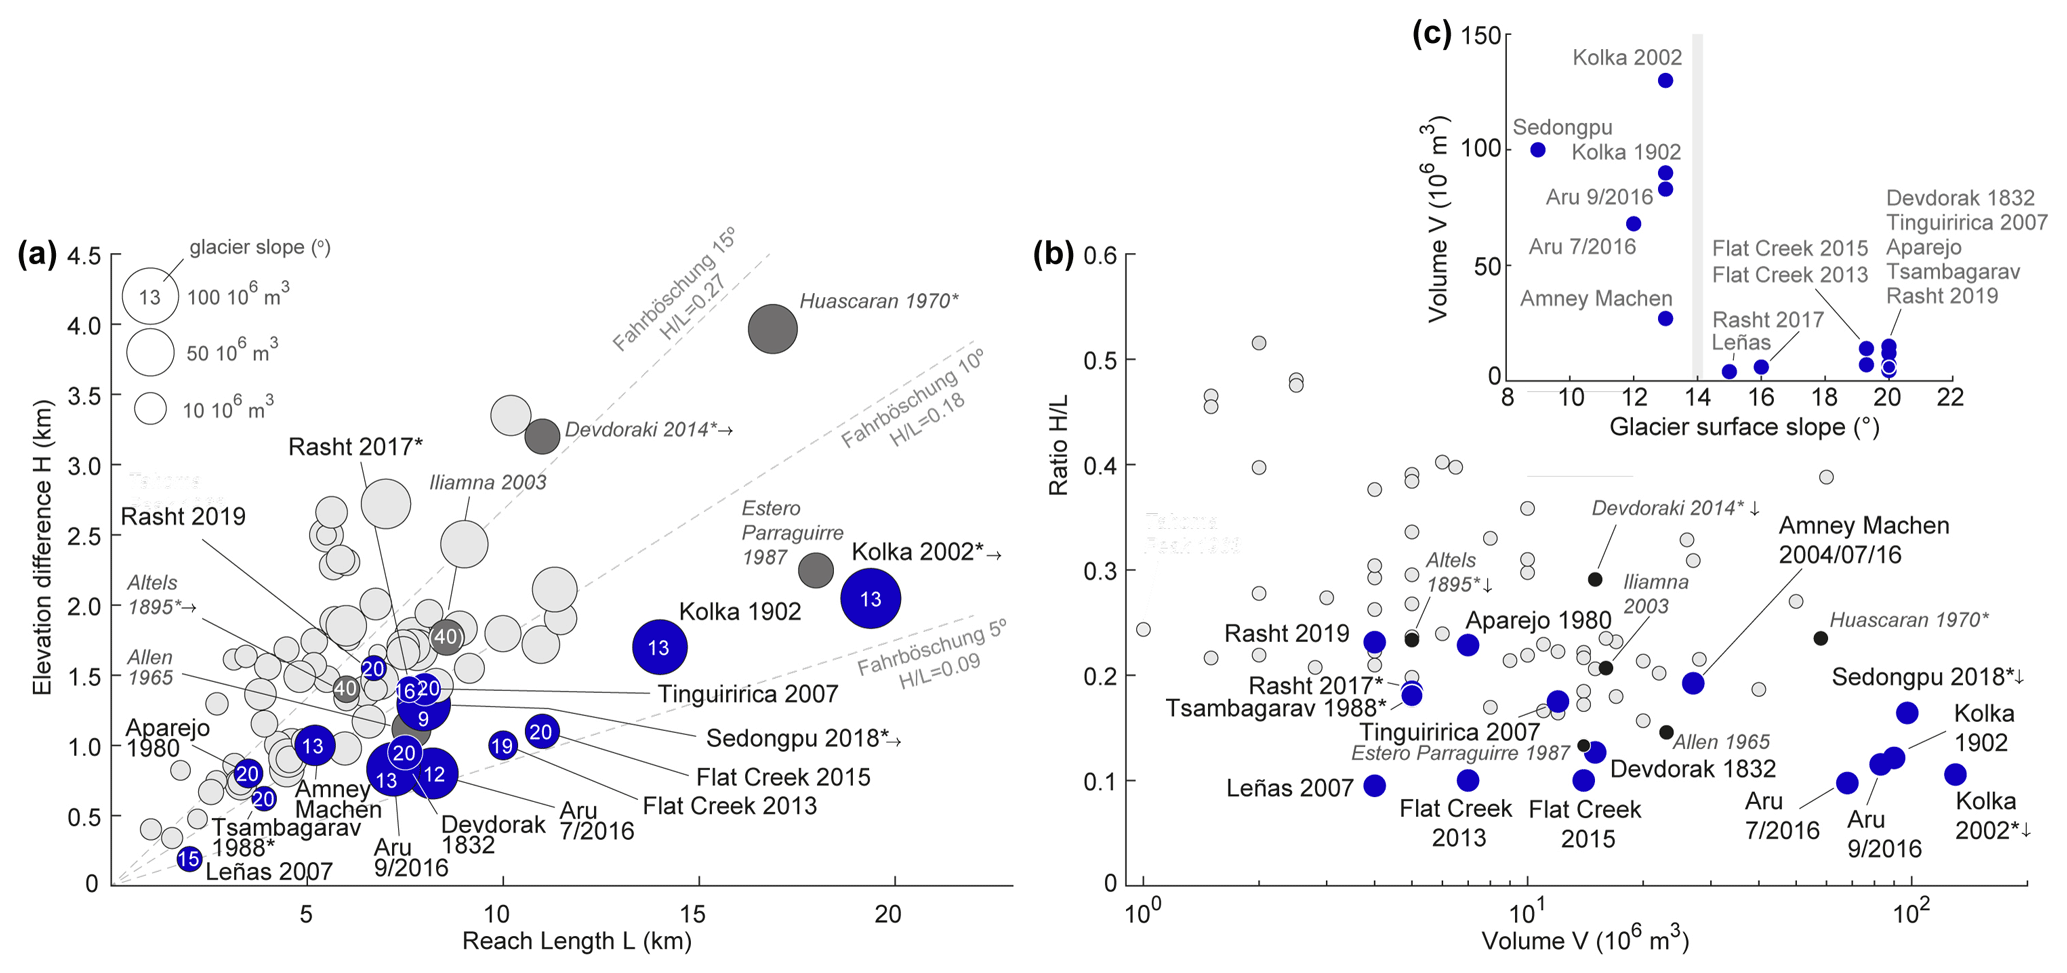
Bonus 2: Our colleague Emmanuel Thibert (INRAE) asked us to check the ratio between horizontal reach (L) and elevation difference (H). This ratio (H/L) is “the apparent friction coefficient or the angle of reach calculated from the uppermost scarp of the slope failure to the lowermost part of the mass movement deposits” (Kääb et al., 2021). The Kyrgyzstan avalanche traveled 2150 m and the elevation drop was 800 m. H/L is thus 0.37, which is relatively small compared to others much larger and more mobile low-angle glacier detachments such the Aru twin collapses, according to Andy Kääb’s compilation.
Harry Shimmin’s footage was super impressive. We cannot even imagine how scary would be an avalanche 100 time larger and much more mobile. Yet, they did happen in the past!
Thanks a lot to the Dinamis and CIEST² teams, they were super reactive to task the satellites or deliver archive images.
Etienne & Simon