Three snow seasons in the Pyrenees through the eyes of Sentinel-2 and Landsat-8
On June 23 we will celebrate the third anniversary of Sentinel-2A in orbit. With three years of data we can start looking at the inter-annual variability of biophysical variables, like.. (random example), the snow cover. This is what I attempted to do for the Theia workshop. I downloaded all available snow cover products from Theia over the Central Pyrenees (tile 31TCH) and I generated additional snow maps from the Theia Landsat-8 level-2A products using let-it-snow processor. Landsat-8 images enable to increase the frequency of observations when only Sentinel-2A was operational between 2015 to 2017. I resampled the Landsat-8 snow maps to the same reference grid as Sentinel-2 at 20 m resolution using the nearest neighbor method. I cropped all snow maps to the intersection of the Sentinel-2 tile (green polygon) and Landsat-8 tile (red polygon).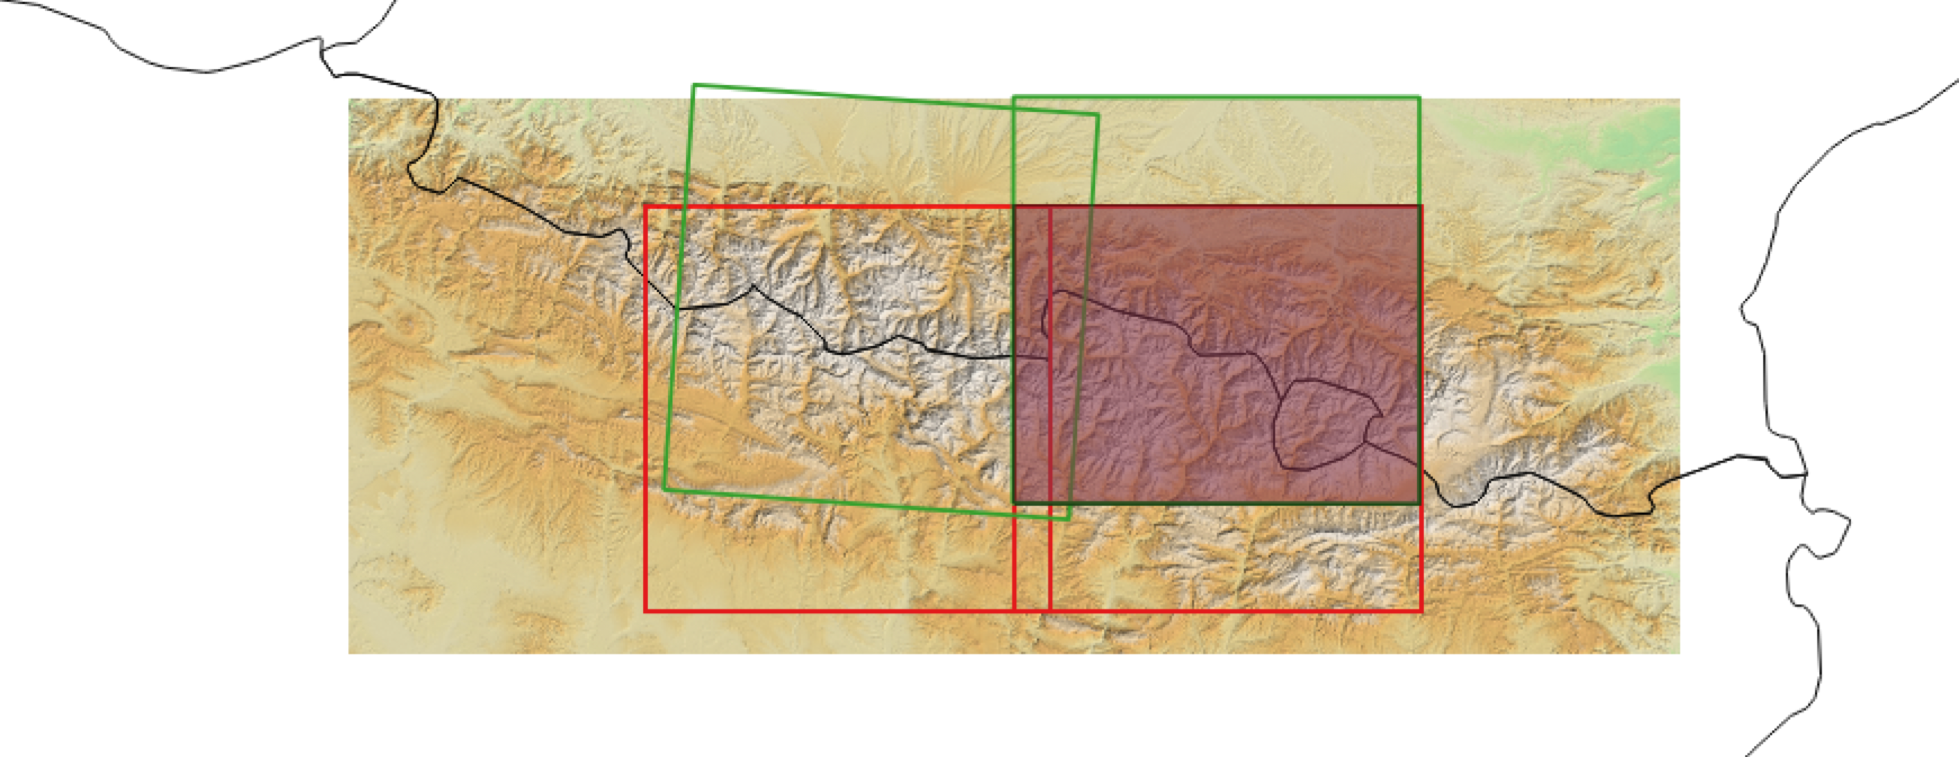
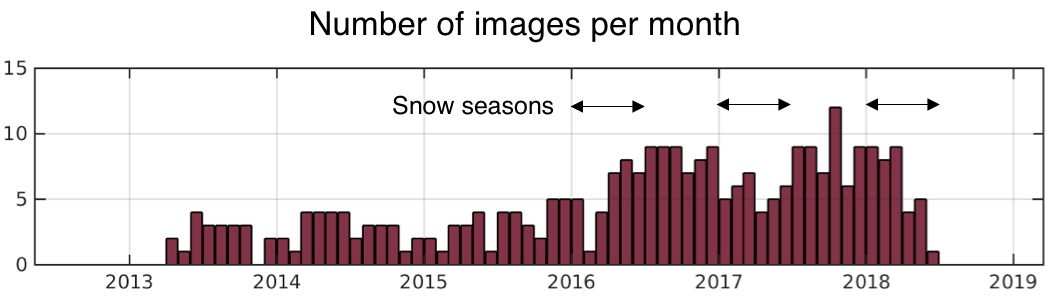
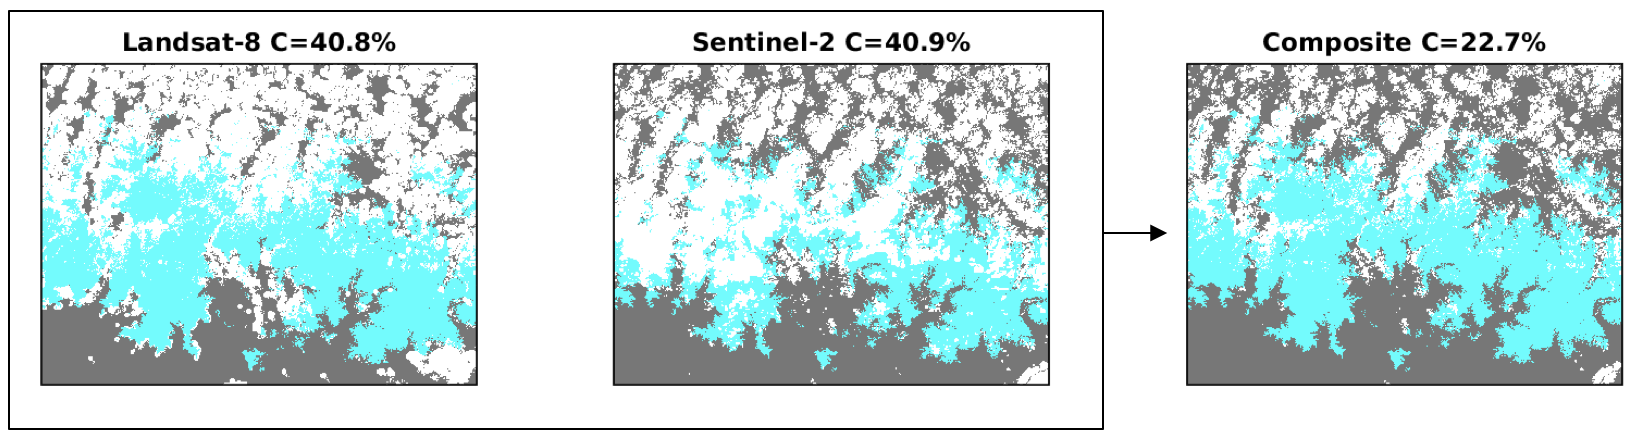
When there was a snow map from Sentinel-2 (S2) and Landsat-8 (L8) on the same day, I merged them into a composite using a simple pixel-based rule:
If S2 is non-valid then: composite=L8, else: composite=S2
where a « non-valid pixel » is a cloud pixel or a no-data pixel. I give the priority to S2 because of its higher spatial resolution, but also because the better temporal resolution of the Sentinel-2 mission improves the cloud mask in Theia products. This first step reduces the amount of non-valid pixels (e.g. cloud pixels in % indicated in the figure below):
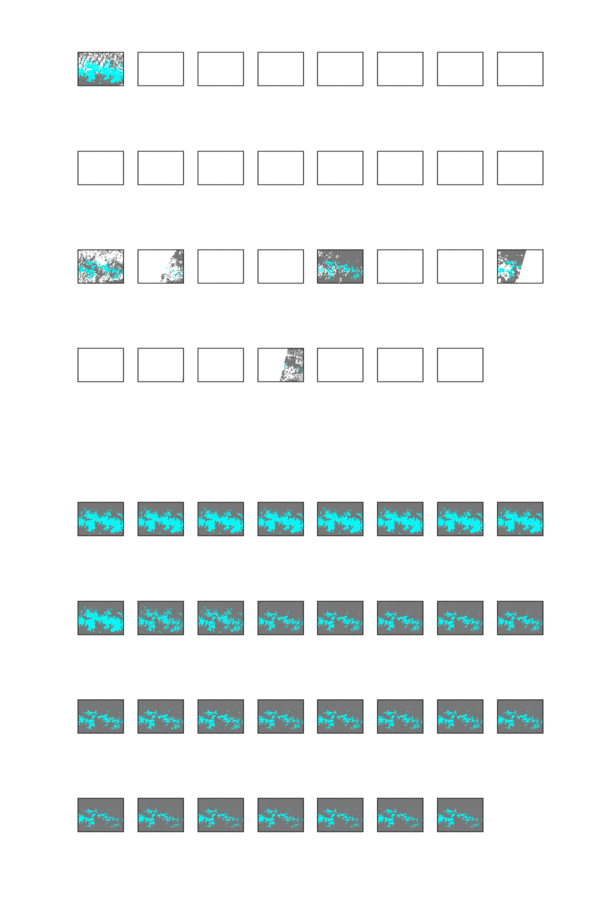
Then I generated a cloud-free time series of daily snow cover maps from 01 Sep 2015 to 31 May 2018 by interpolation in the temporal dimension
using the closest valid pixel as shown below:
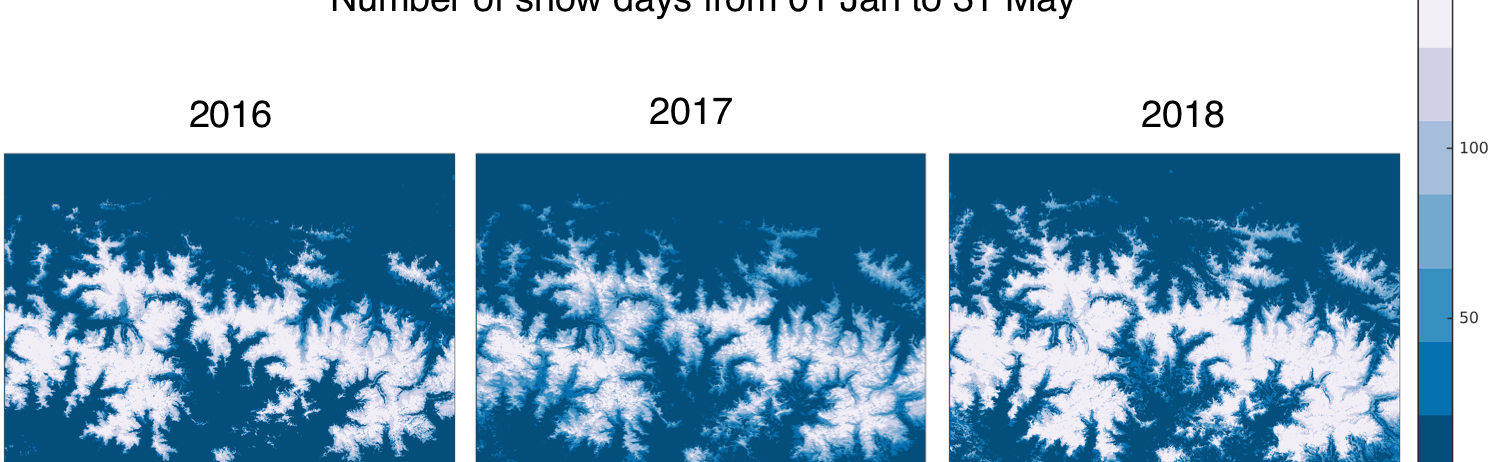
I computed the sum of snow pixels in the resulting stack of cloud-free snow maps along the time dimension, for each of the past three snow seasons. This provides the number of snow days per pixel (AKA a snow cover duration map).
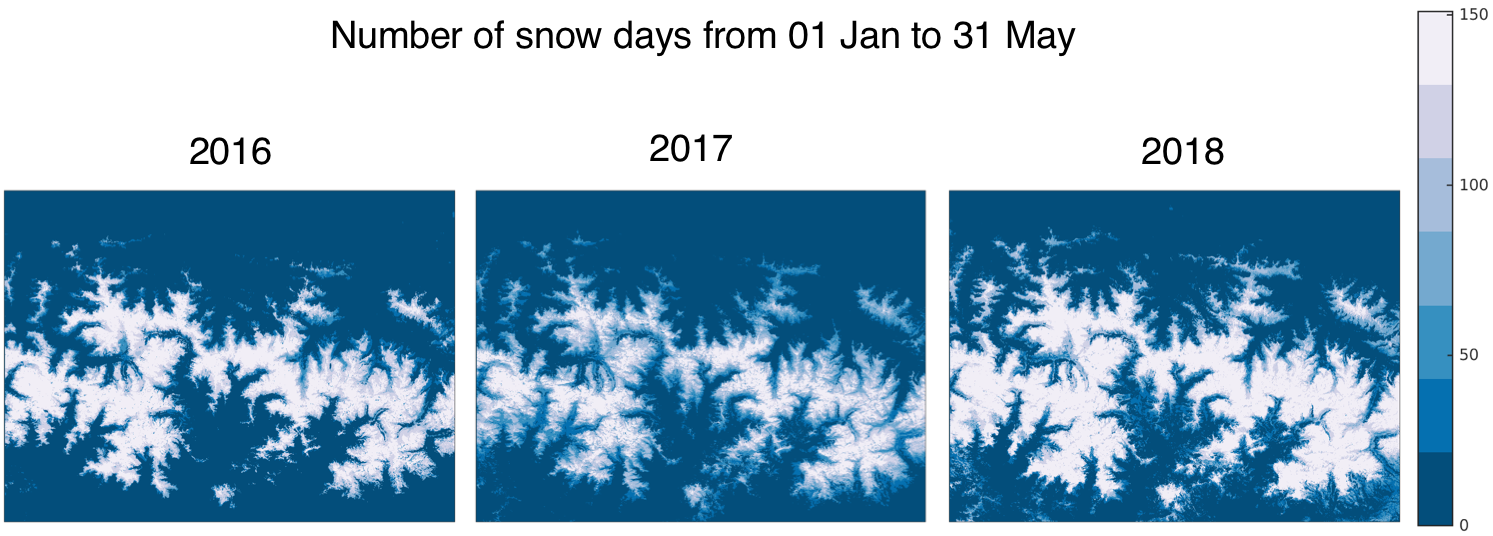
These maps show that the area covered by a permanent snowpack was larger in 2018. To further analyze the results I aggregated the snow cover duration by elevation band of 200 m starting from elevation band 0 m-200 m, etc. and plotted the data as boxplots (outliers were removed for clarity)
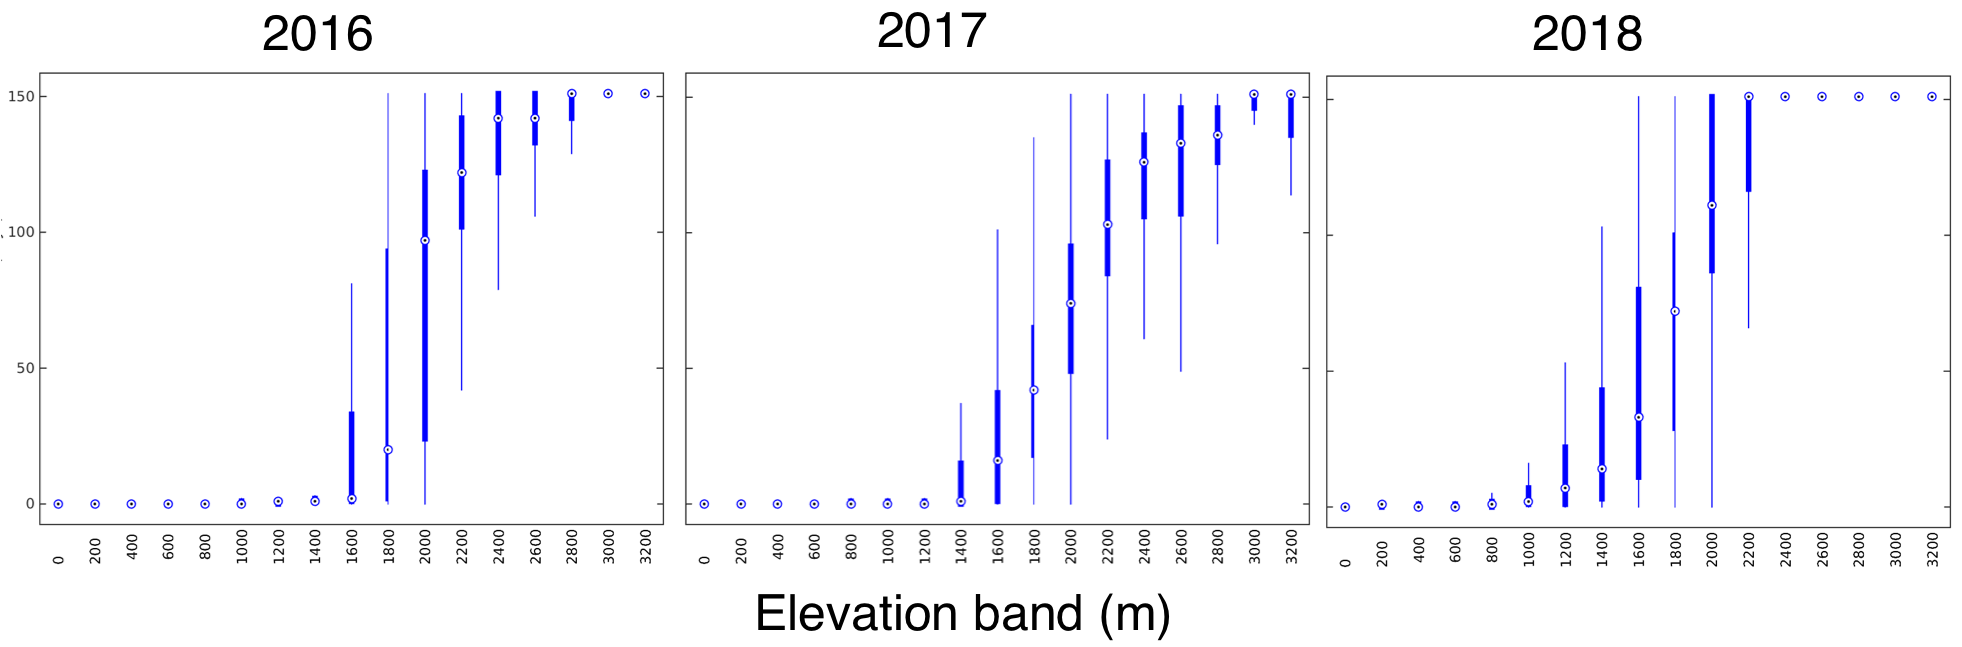
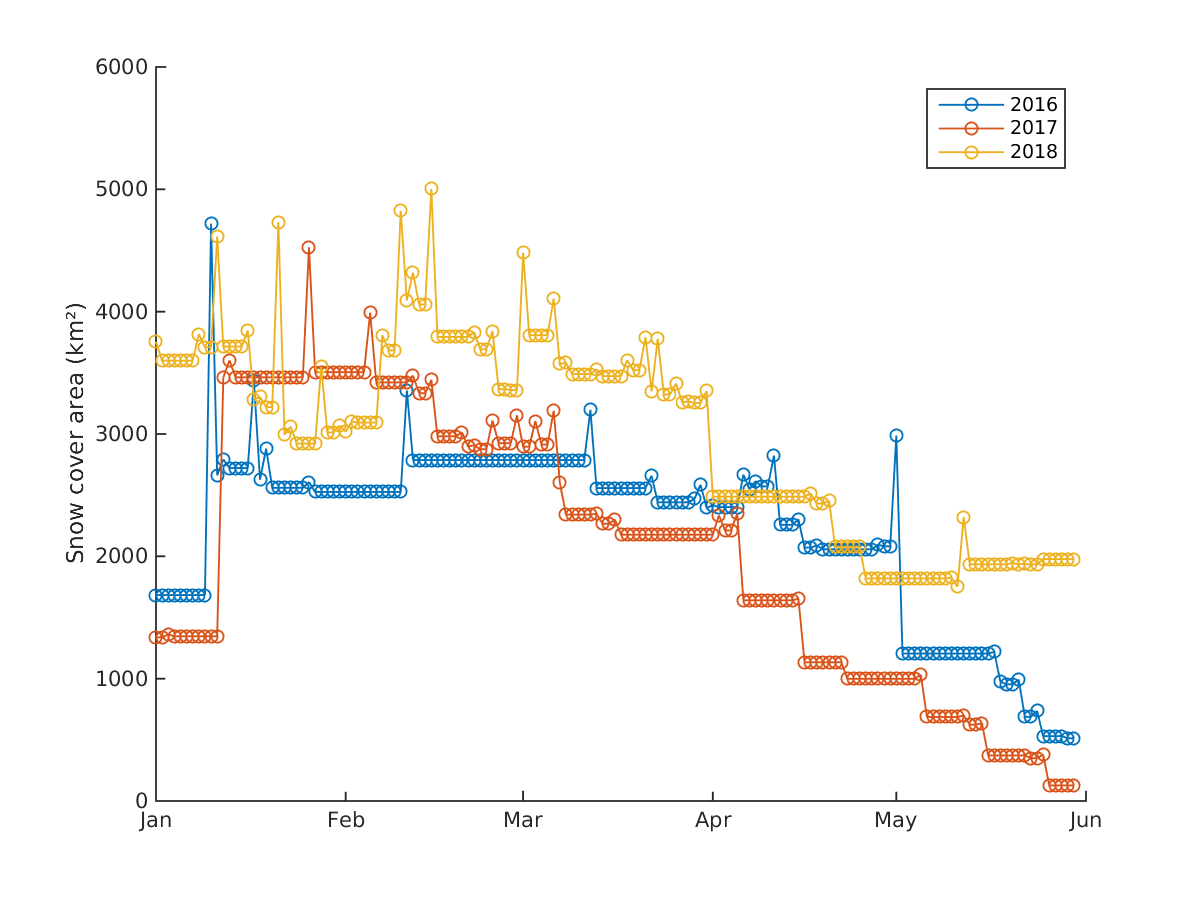
The Theia snow products indicate that snow cover was virtually permanent above 2400 m in 2018 from 01 Jan to 31 May, in contrast with 2017 and 2016. Finally, looking at the evolution of the snow cover area from these data, it seems that the exceptional 2018 snow season is not over yet!
Aneto peak (3304 m) on 07 Jun 2018 vs. 01 Jun 2017
Col des Tentes (2200 m) near Gavarnie on 08 June 2018: