The level 3A products
Among the products prepared to be processed by the THEIA land data center, the level 3A product was not yet described in this blog. The level 3A products provide a monthly synthesis of the level 2A. These products should be very useful for the following reasons :
- The level 3A, produced once a month, uses up to six times less volume than the level 2A products acquires during a month.
- The level 3A provides a regular time sampling of the reflectances variation, while the level 2A sampling is dependent on the cloud cover
- Several processing methods and applications are hindered by the data gaps due to cloud cover. The level 3A product aims at minimizing the residual gaps.
Thanks to SPOT4 (Take5) data set, we were able to try and test several methods to produce level 3A products on varous types of landscapes and climates. This work, suprvised by Mireille Huc and myself, is performed by Mohamed Kadiri, at CESBIO, and is funded by the CNES budget of THEIA Land Data Center. Our method consists in computing, foe each pixel, a weighted average of the surface reflectances of the cloud free observations, obtained within a N day distance frome the central date TO of the level 3A product. For instance, the example below was obtained with N=21, for the 15 th of each month. As a result, the level 2A used in the average for the level 3A product dated on March the 15th, were acquired from Feruary the 24th to April the 4th.
https://www.cesbio.cnrs.fr/multitemp/wp-content/uploads/sites/11/2014/02/N3A.pdf
The weighted average gives more weight to
- the cloud free images
- the pixels which are far from clouds
- the images with a low aerosol content
- the images acquired near the level 3A product date.
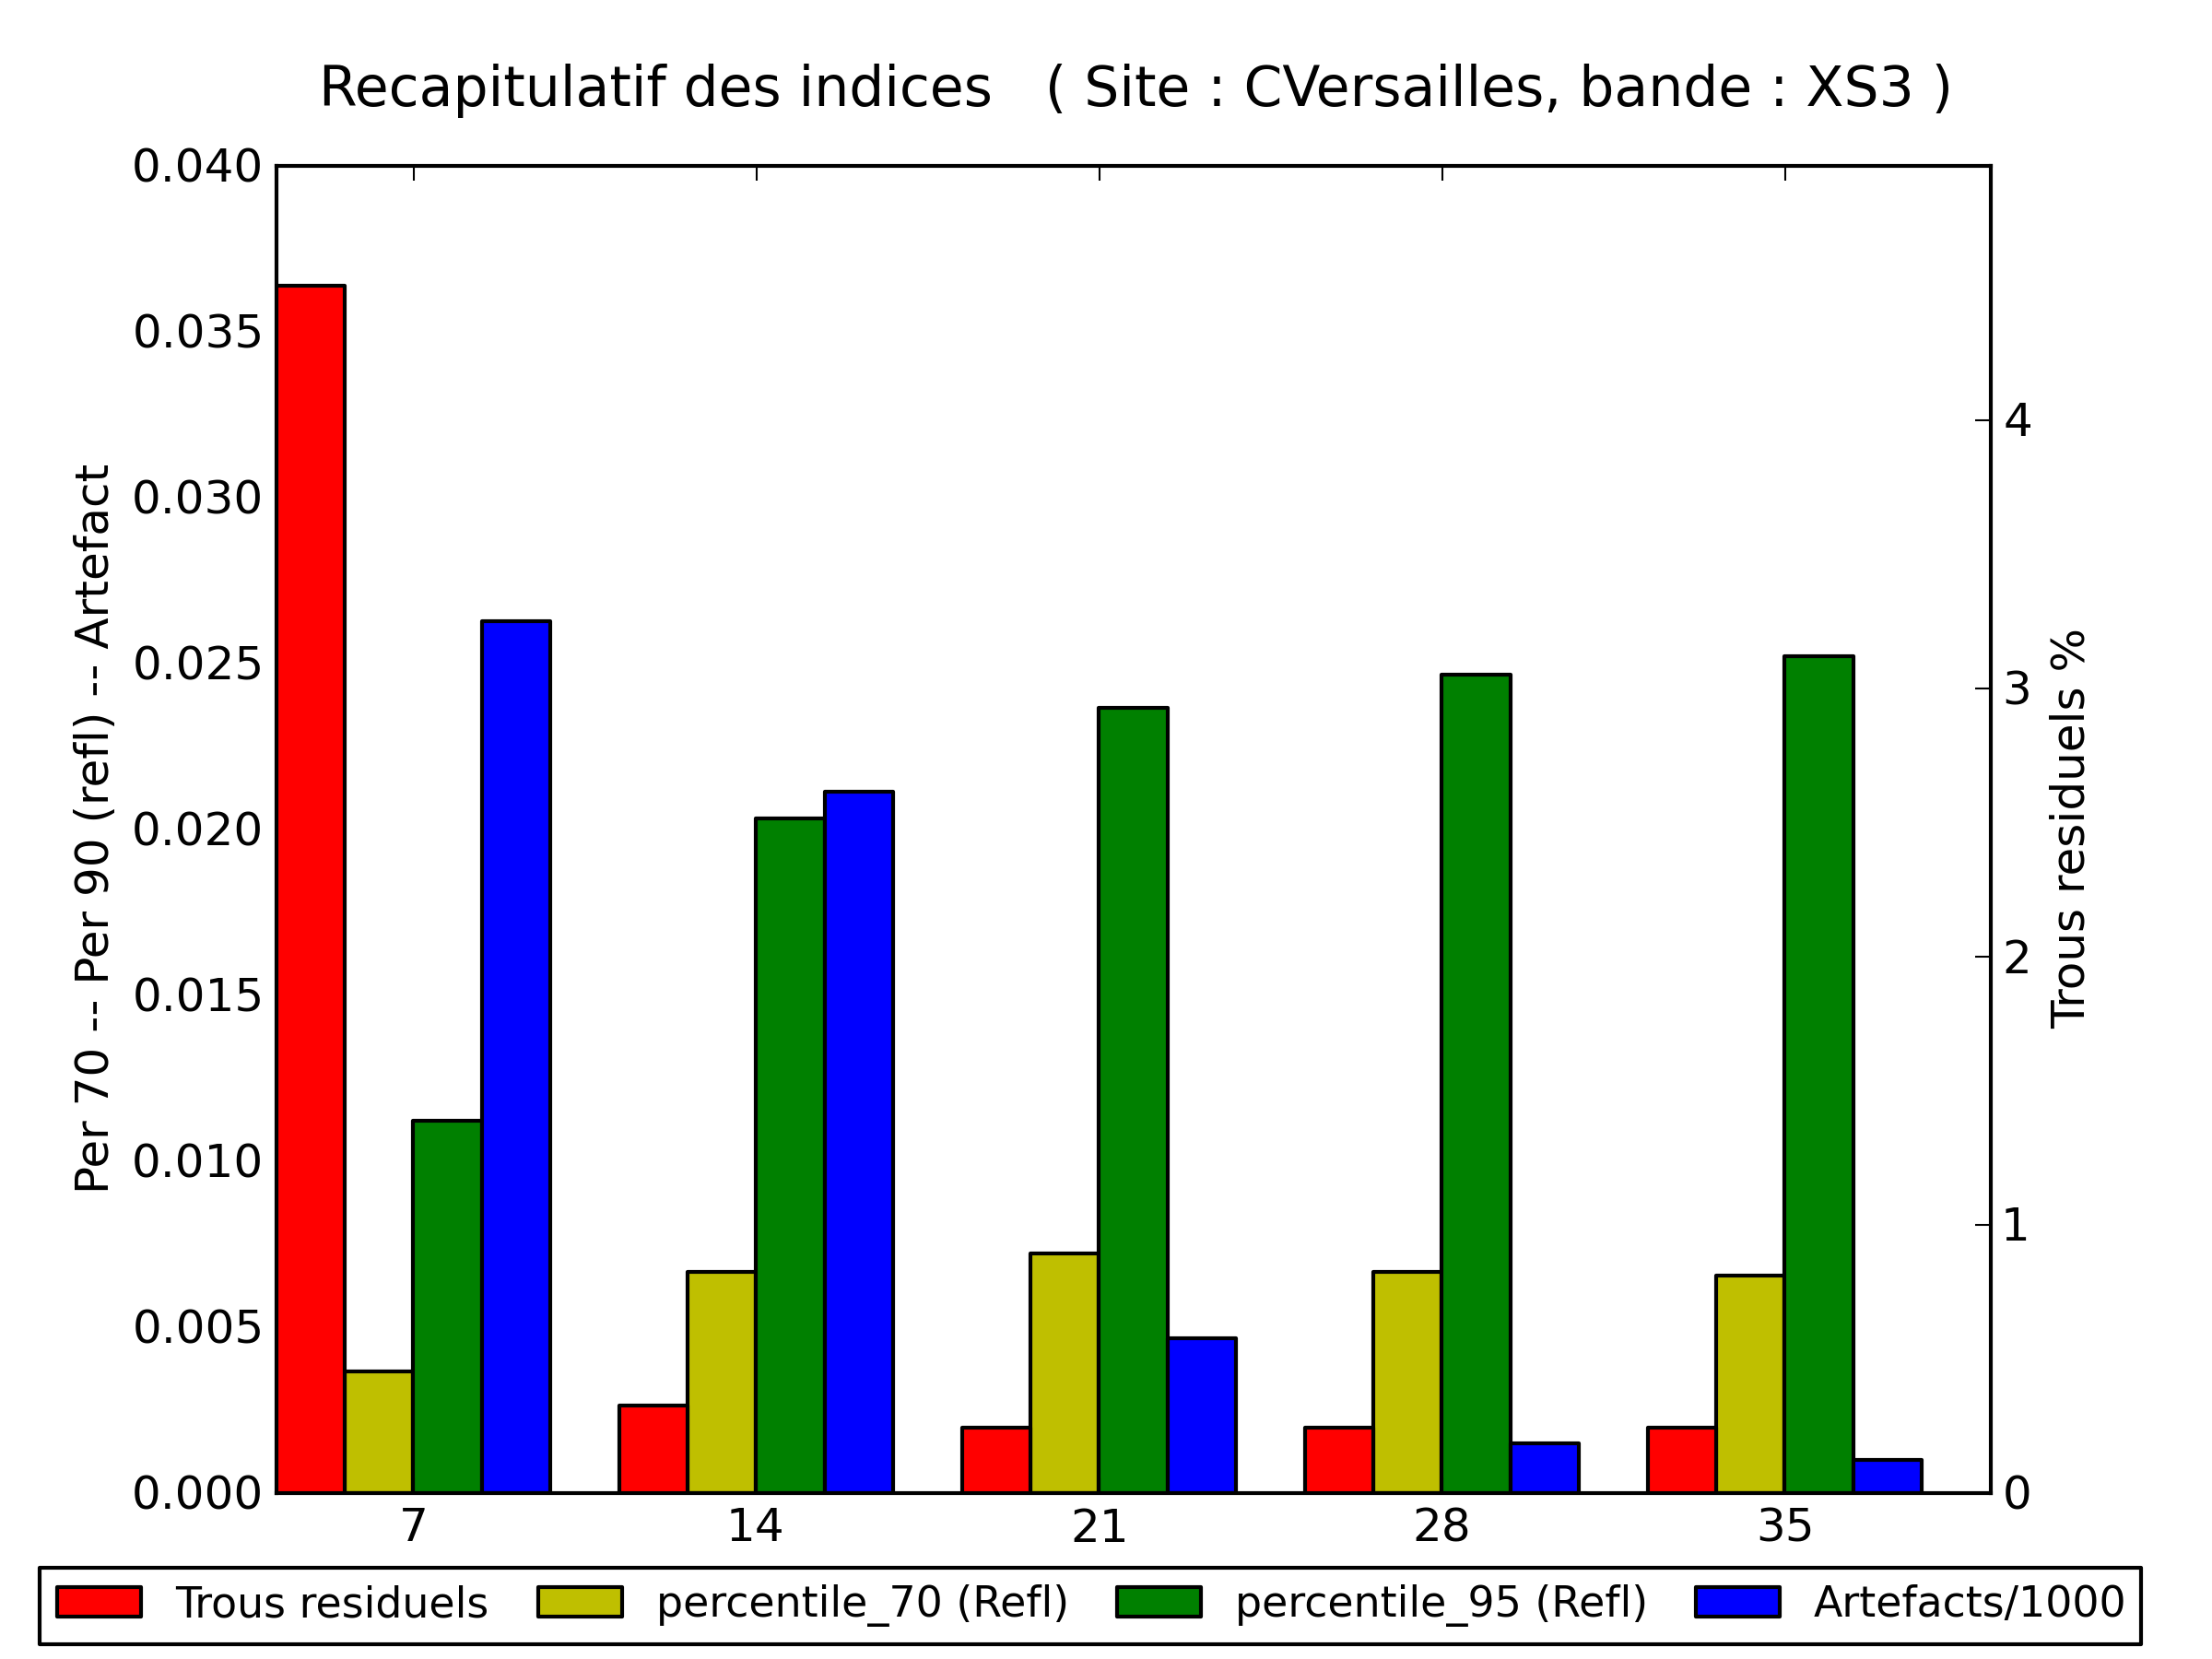
Les values of the weight and of the duration N, have a large influence on the product data quality. To tune their values, we set up three quality criteria :
- The percentage of residual data gaps for which all the observations were cloudy
- The difference of the level 3A reflectances with the values of a selected level 2A product acquired near the central date T0.
- A measurement of the artefacts standard deviation. The artefacts appear near the borders of data gaps that affect one of the dates used in the level 3A synthesis.
For instance, here are the performances obtained on the Versailles site, which was heavily clouded in the spring of 2013. For this site, one can note, that the residual gap percentage is very low despite the bad weather, confirming that Sentinel-2 should be able to provide cloud free Level 3A products each month. For this site, the optimal duration of the synthesis is somewhere between 2* 21 and 2*28 days.
For Sentinel-2, the level 3A will have to include a correction for directional effects, in order to use in the same level 3A product, the data acquired from different satellite tracks, from different viewing angles. Finally, as an option, we might include a gap-filling method to fill the residual gaps.In short, we still have work to do. A comparison with the classical NDVI Maximum Value Composite is provided in this post.