
Comparison of Level 3A compositing methods
 =>
=>  As said in a previous post, we are testing various methods of level 3A production, using SPOT4 (Take 5). The Theia Land Data Center will the use these methods to process Sentinel 2 data. In case you did not click on the link above, let’s recall that the level 3A products are monthly composite products of cloud free reflectances. For each pixel, our method computes the weighted average of the reflectances of the dates when the pixel is cloud free. For more details, you will need to follow this link. The work of Mohamed Kadiri at CESBIO, which is funded by the CNES budget for Theia, adressed first the definition of quality indexes for composite products (for more details, may I suggest that you follow this link ?). This work showed that our product has nice performance, but we knew some one would ask us to compare them to the classical methods for level 3A products. Therefore, we compared our product with the famous NDVI Maximum Value Composite (NDVI MVC), developped by our remote sensing ancestors, and used since the most remote antiquity to process AVHRR time series. This method consists in using for each pixel of the level 3A, the reflectances of the date which has the greatest NDVI. Why ? Mostly because the NDVI of a cloud is very low, often negative, and therefore this method will rather select cloud free pixels. The NDVI MVC comes from a time when the cloud masks were not very accurate.
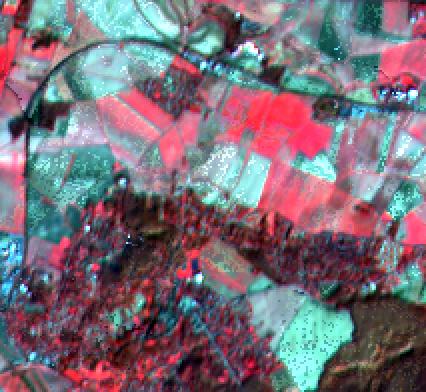 | 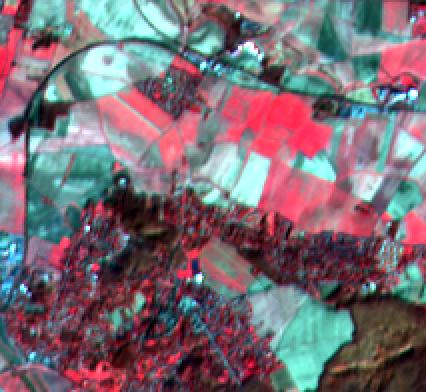 |
| Example of a monthly synthesis obtained with the NDVI MVC methods | Example of a monthly synthesis obtained with the weighted average method |
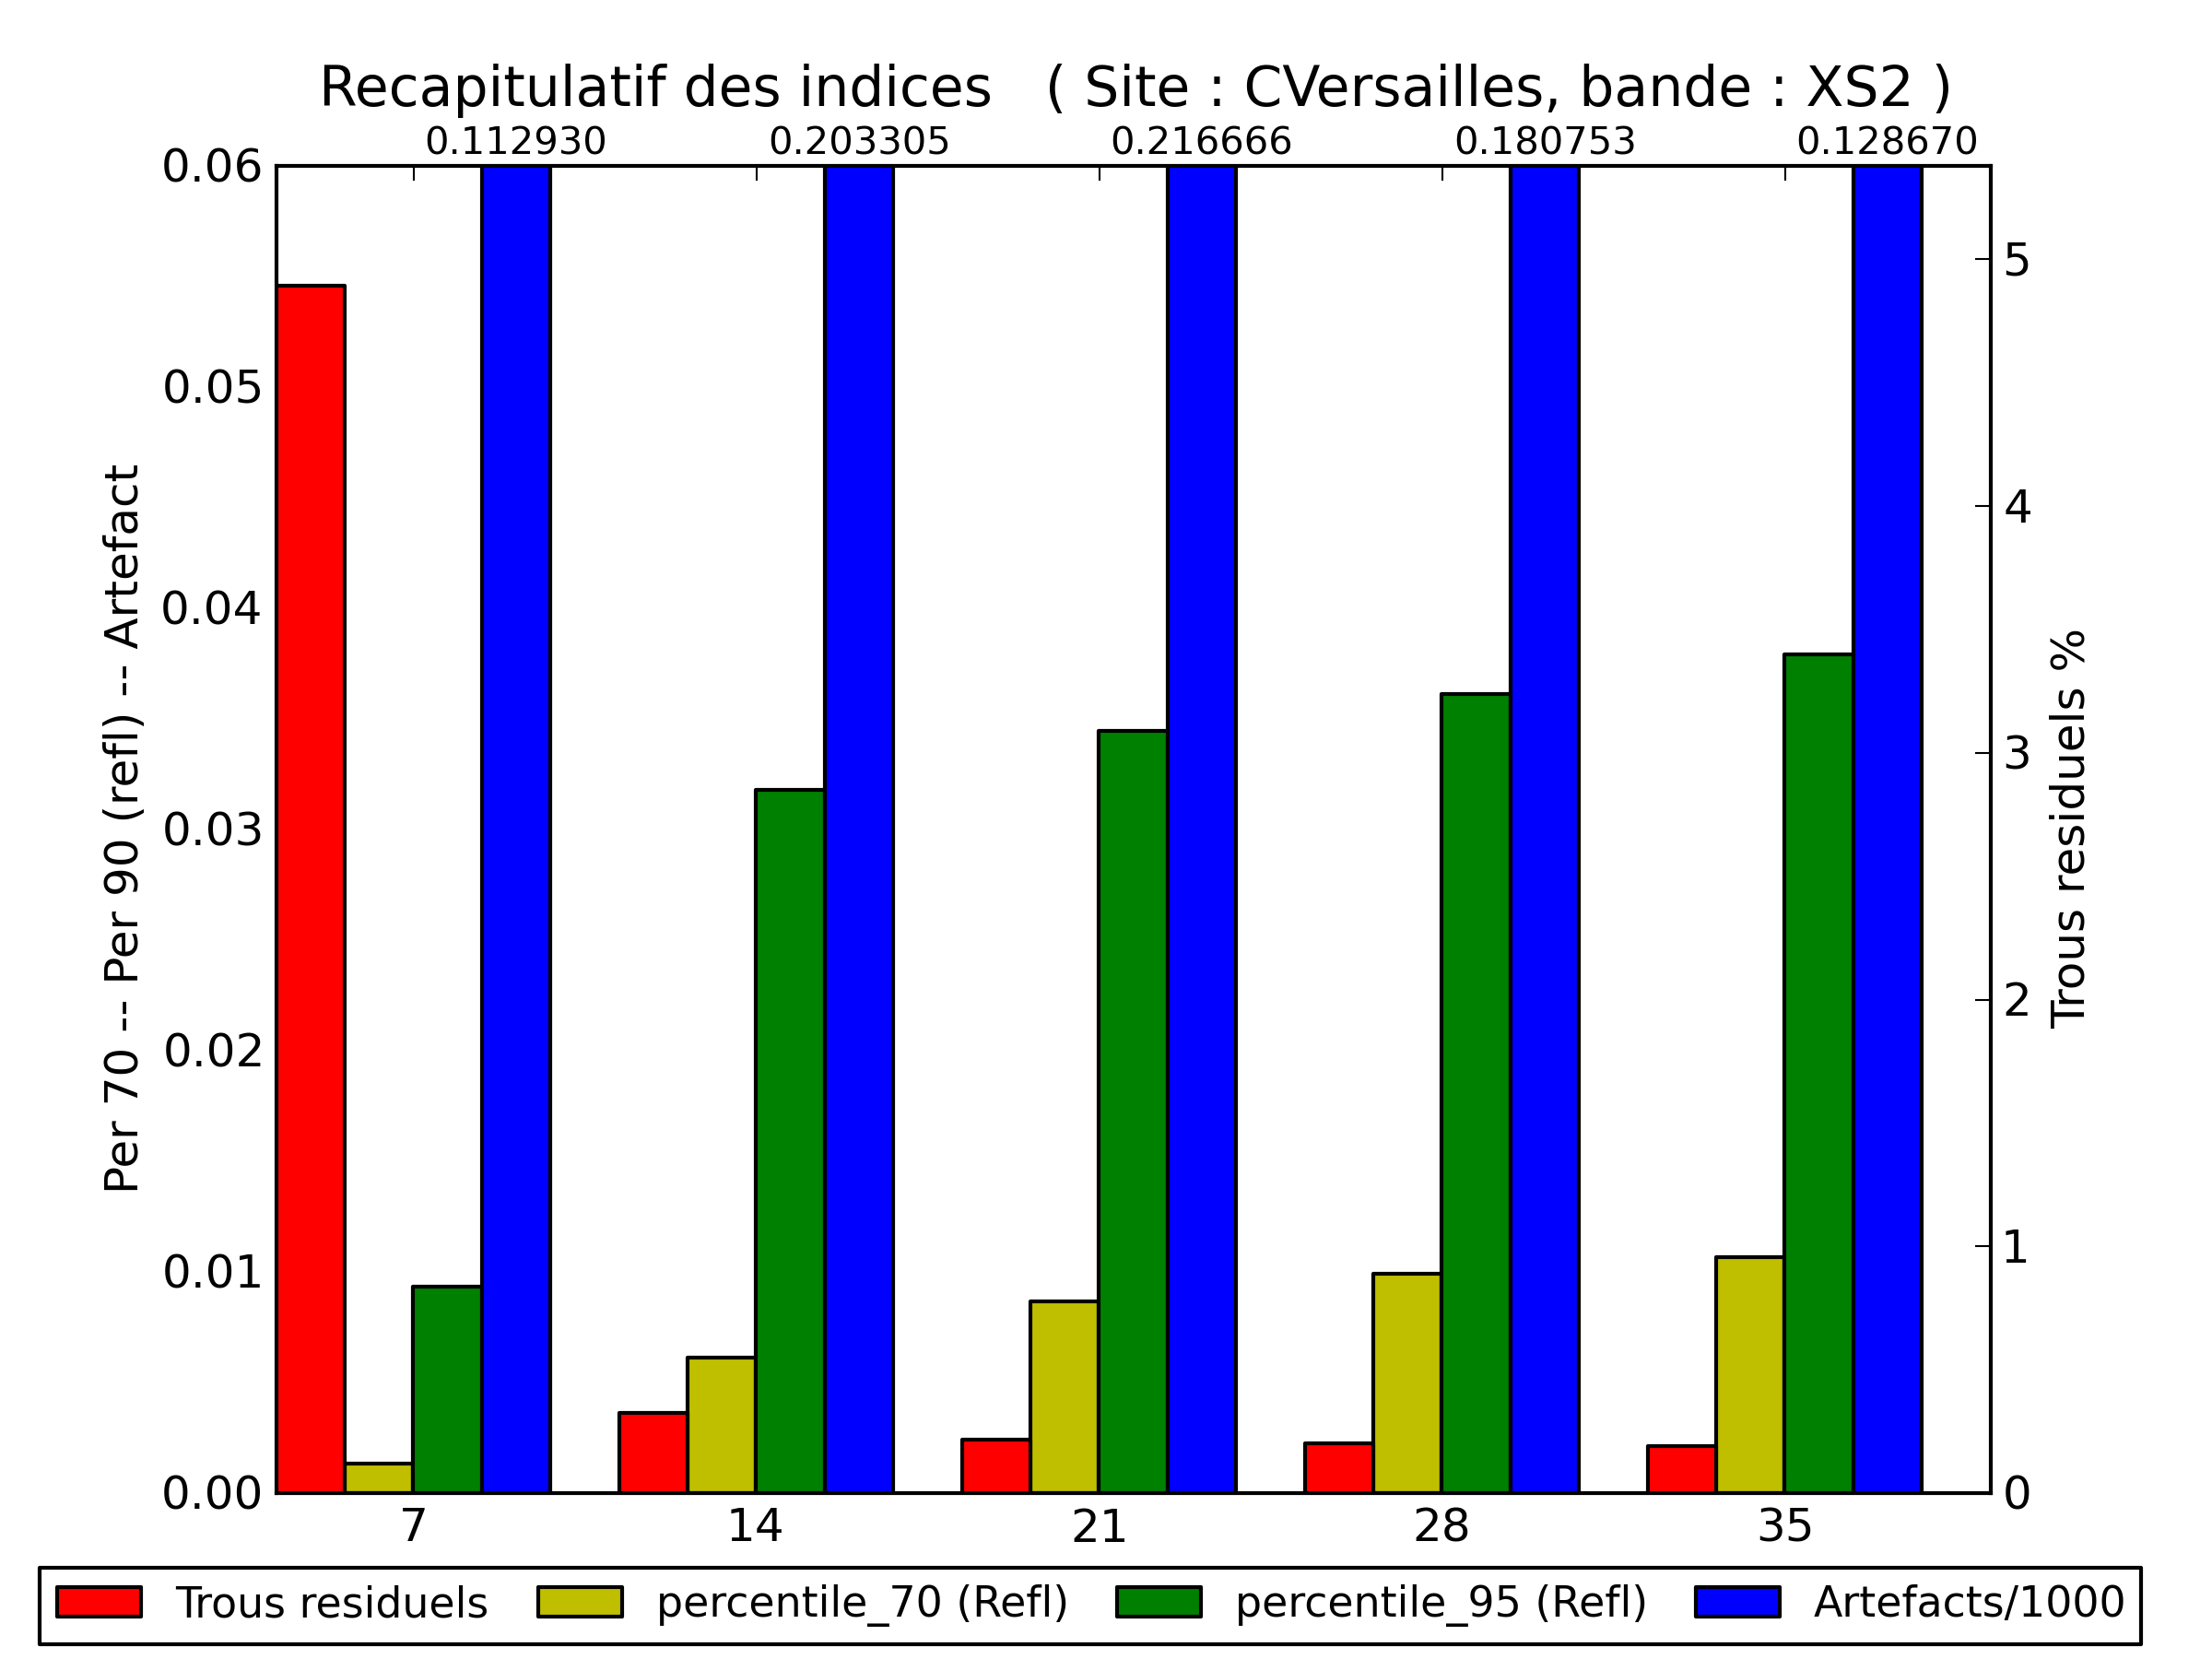
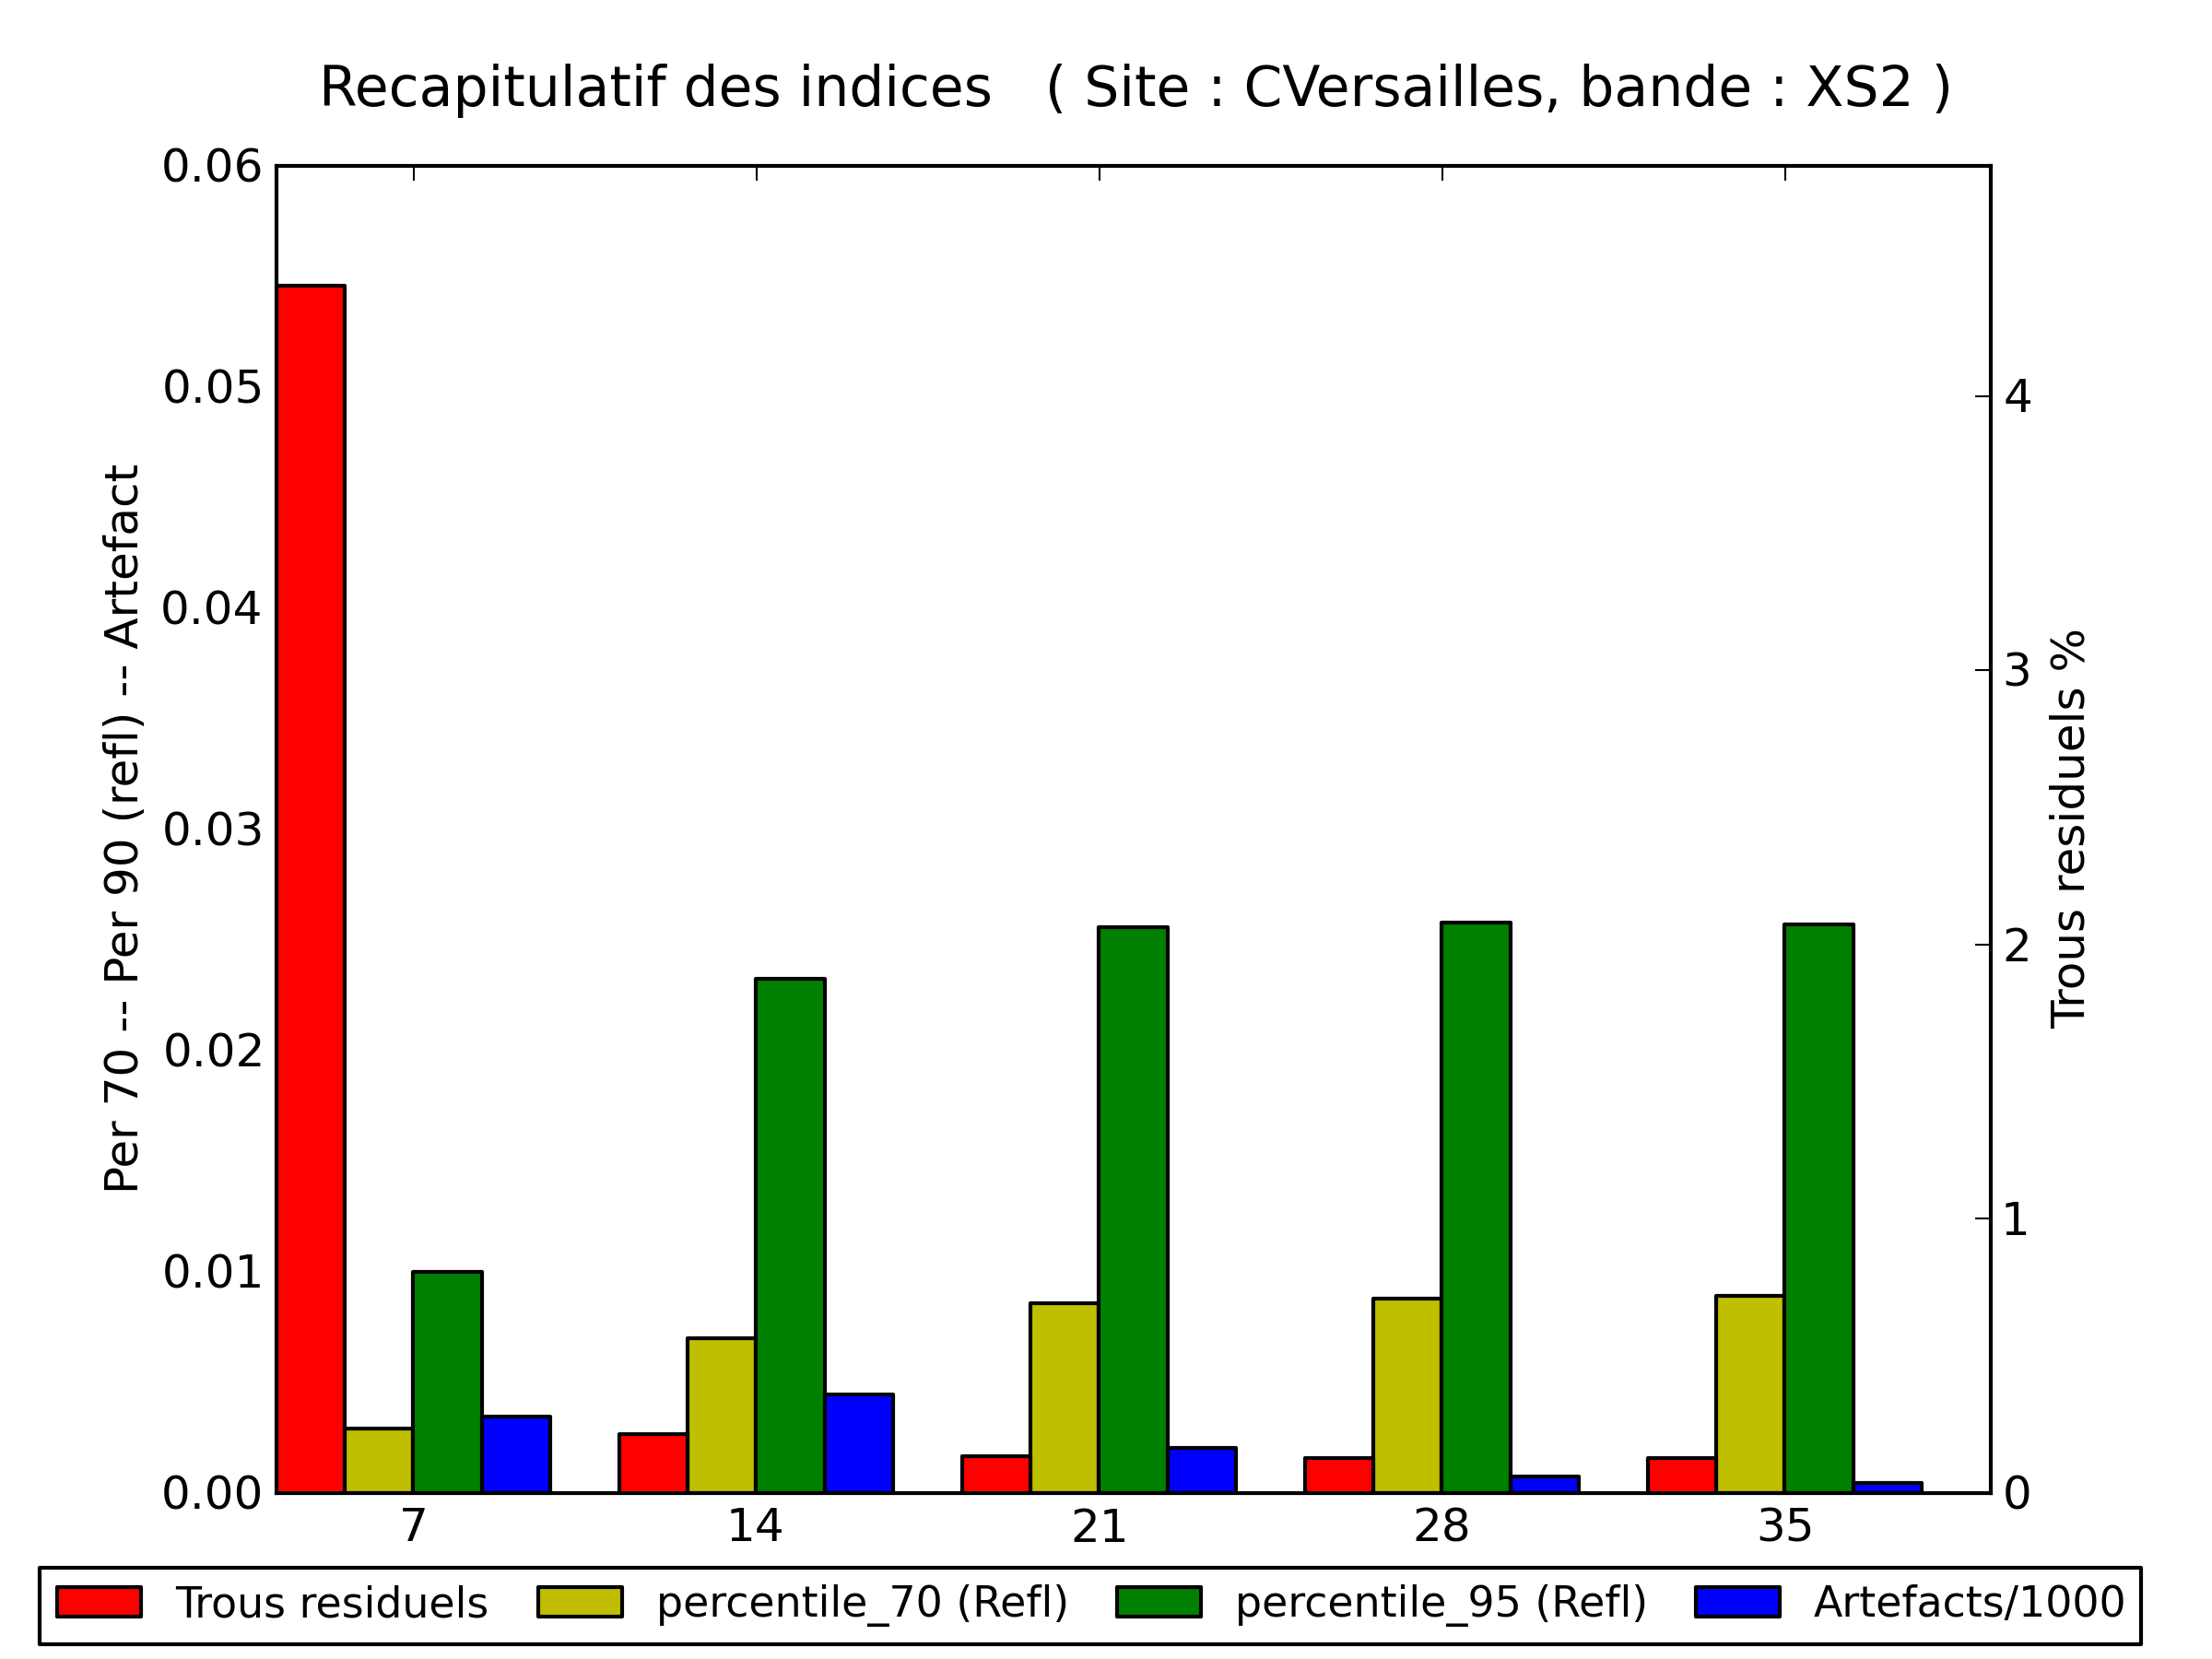
This post uses the SPOT4-Take5 data to show a comparison of the performances obtained on the Versailles site, with the NDVI MVC method on the left, and the weighted average on the right. One can clearly see, on the left, the presence artefacts made of whiter and darker dots which are not seen on the image on the right. These artefacts appear when the selected date changes from one pixel to the other. These artefacts are much less visible on the vegetation covered plots, as, for this composite obtained in spring, the vegetation increases quickly, and all the pixels come from the last cloud free date of the synthesis. If we have a look at our quality indicators, which were described in our previous post about composite products , it is obvious that the performances obtained by the weighted average method are much better than those of the NDVI MVC method, either as regards the similarity to the central date image of the Level 3A (in yellow, for the 70 % best pixels and in green for the 95% best pixels), and moreover as regards as the amplitude of artefacts (in blue). The abscissa of the plot is the half of the number of days used in the synthesis, and our recommended value is 21.
| NDVI Maximum Value Composite | Weighted Average Composite |
 |  |

