Scientists anticipate another glacier collapse in Tibet from satellite data
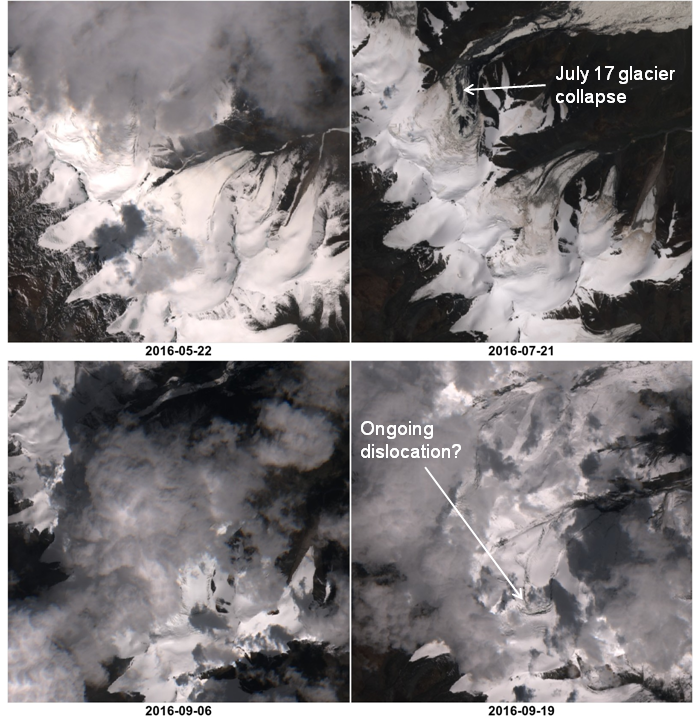
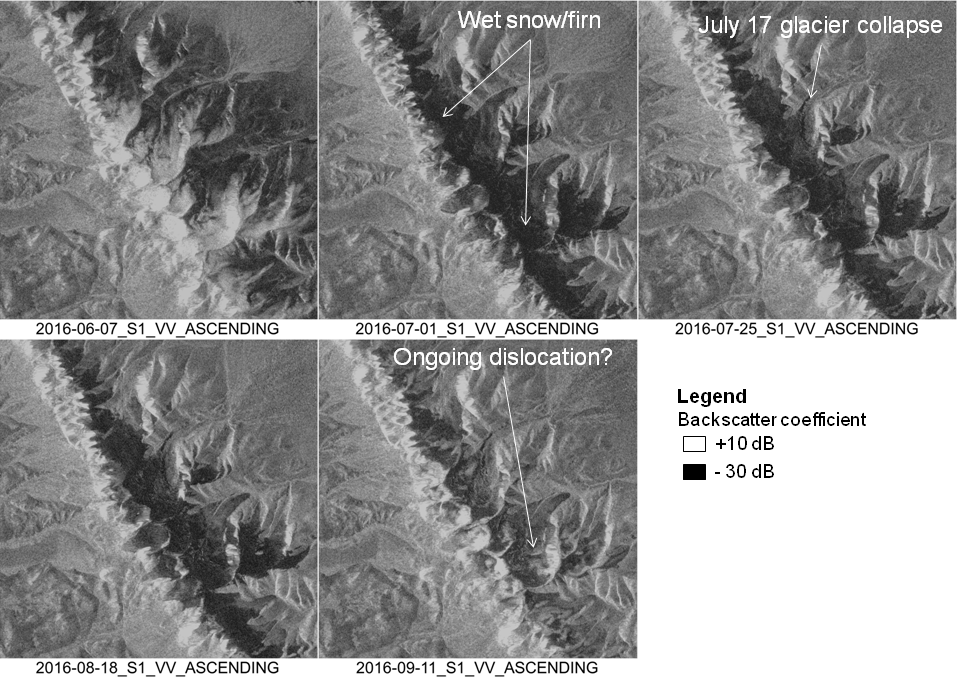
The giant ice avalanche that occurred in Tibet on 17 July 2016 and killed 9 people [1] urged scientists to scrutinize every available data to understand what caused such a glacier collapse. In doing so, they witnessed in near real time the ongoing collapse of a second glacier.
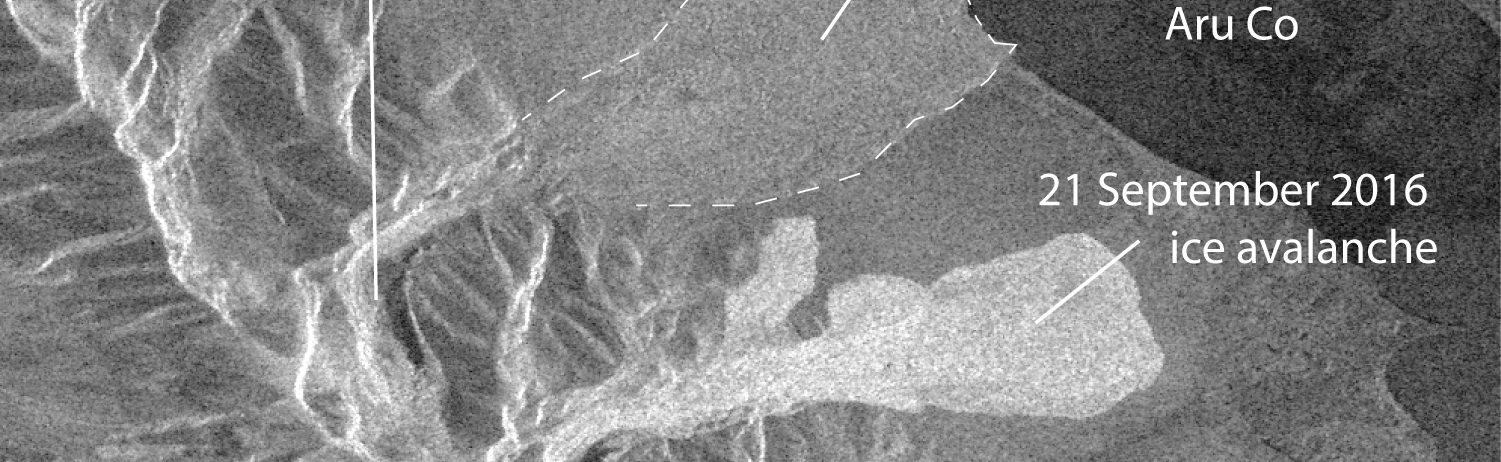
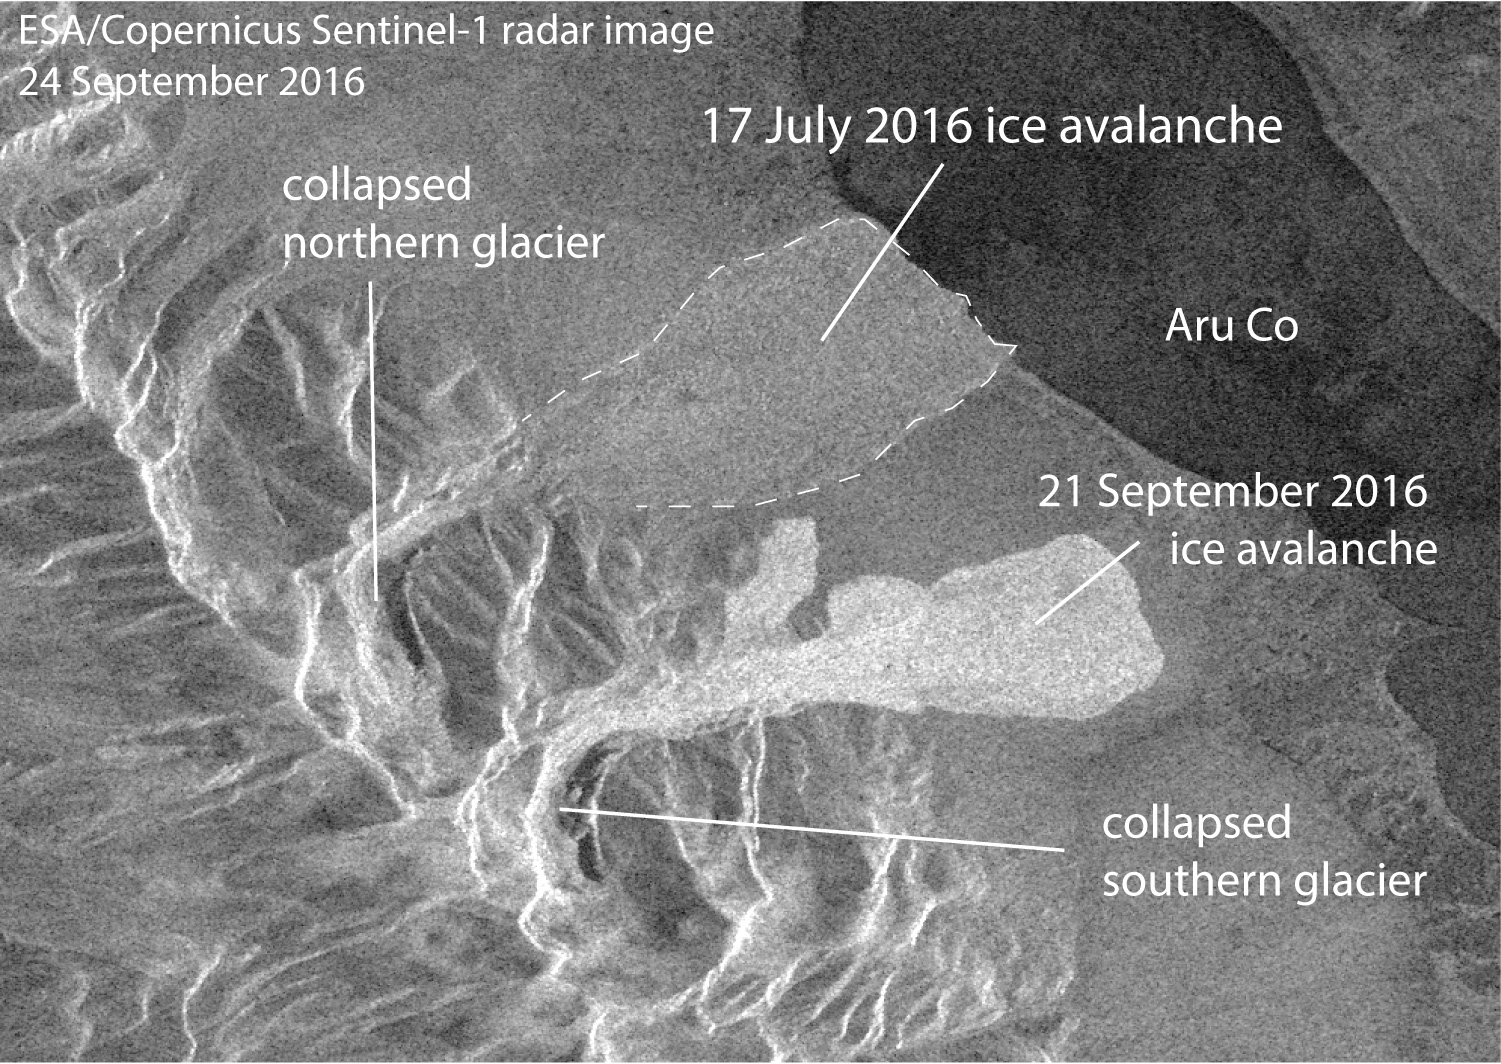
In China, Zong Jibiao conducted the first field survey of the avalanche site and reported that the debris thickness reached up to 30 m. In Norway, Andreas Kääb and Adrien Gilbert gathered a number of satellite datasets to estimate the volume of the avalanche (40 to 70 millions cubic meters) and to reconstruct the glacier evolution before the collapse. They observed that the glacier showed some signs of abnormal activity before the event, including an atypical surging activity [2] for the last 10 years, and intense crevassing in the dislocation area just a few days before the event. In Canada, Joseph Shea looked at earthquake records and climate data in the area but found no apparent trigger. In Germany, Silvan Leinss used TanDEM-X digital elevation models to map the glacier elevation changes between 2011 and 2013 and noticed that the neighbour glacier, just south of the one that collapsed in July showed similar signs of destabilization (surge). Alerted by this suspicious behavior, we examined the most recent imagery provided by the ESA Copernicus satellites Sentinel-1 and Sentinel-2 and found signs of an ongoing dislocation. The information was sent to Chinese colleagues by Andreas on the same day (Sep 21) in late evening (Oslo time).
On Sep 22, glaciologist Lide Tian informed us that the second glacier collapsed and that nobody was hurt.
We know since today that the glacier detached in the morning (05 am and 11 am local time) of Sep 21 hence the warning arrived after the avalanche. However, this case is a spectacular illustration of the new, early warning capabilities brought by the systematic observation of our planet from high resolution satellites, and the advent of the EU Copernicus program in particular [3]. The Sep 19 Sentinel-2A image was distributed on Sep 21, but sometimes Sentinel images are available from one day to the next, including in the friendly interface of the Sentinel-Playground for instance.
We will continue on studying these extraordinary events [4]. The fact that two neighbor glaciers collapsed within a period of 9 weeks should give some clues to understand if the underlying mechanisms are related to the climate, the topography or the geology of the area. Here in Toulouse, Etienne Berthier and I have programmed a Pléiades stereo acquisition to help refine the first estimates of the avalanches volumes. [edit 2016-10-21:The acquisition was successful! I posted here some 3D views of the collapse area ]. [edit 2018-02-08 The story continues here: From Multitemp blog to Nature Geoscience] Footnotes [1] The scientific issues on this event were first reported by the Nature website. But satellite views of the site before and after the avalanche were shown for the very first time on this blog! (see here and here)! The imagery was then featured in the NASA’s « Image of the Day » along with an excellent article « Massive and Mysterious Ice Fall in Tibet« . [2] « Surges are slow glacier destabilisations that are common in some parts of the world, for instance in the Karakoram or in Alaska. They can lead to an increase of the glacier flow velocities by a factor of 10 or more, and to a rapid advance of the glacier tongue, but no cases have been known so far where they caused big ice avalanches » (source : « Twin glacier collapse in Tibet puzzles scientists and triggers rapid international collaboration » Glacier and Permafrost Hazards in Mountains (GAPHAZ) 28 September 2016 http://gaphaz.org/files/160928_gaphaz_tibet.pdf) [3] Another outstanding story is that a group of scientists in Switzerland (Yves Bühler et al.) carried out a numerical simulation of the potential avalanche based on the early warning and correctly forecast the general shape of the second avalanche (source : « Twin glacier collapse in Tibet puzzles scientists and triggers rapid international collaboration » Glacier and Permafrost Hazards in Mountains (GAPHAZ) 28 September 2016 http://gaphaz.org/files/160928_gaphaz_tibet.pdf). We learned tonight that Stephen Evans and Keith Delaney in Canada also performed a simulation of the avalanche and found an average velocity of 22 m/s, while local accounts suggest a velocity of about 20 m/s. [4] From the satellite archives we are sure that such an event did not happen in this mountain range at least since 1976 as it can be seen below on this selection of Landsat images (1976-2016) (only the last image is a Sentinel-2 image)

Click here to watch an animation of these images :
https://www.cesbio.cnrs.fr/multitemp/?attachment_id=8792