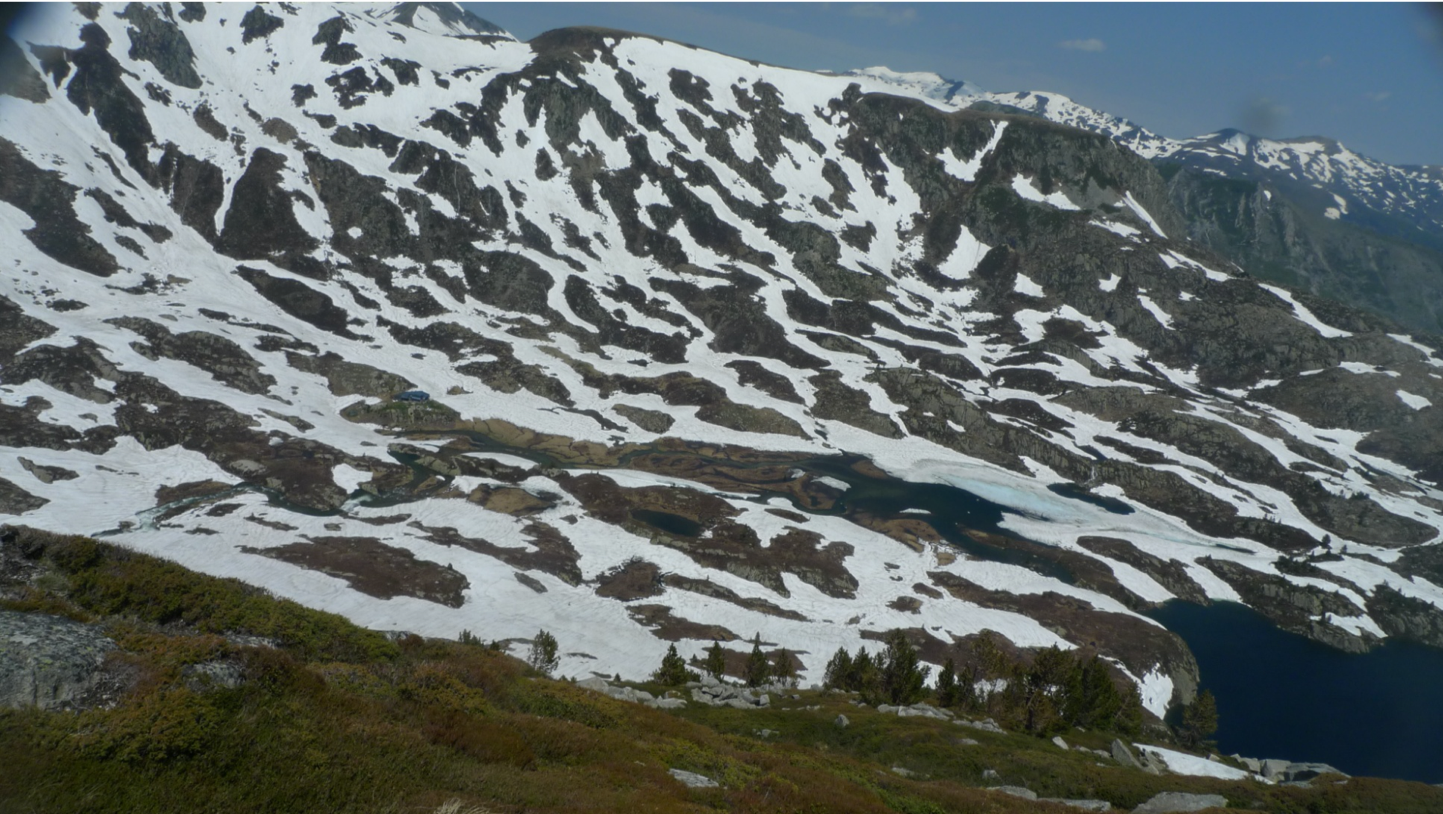
Persistent snow cover area in the Alps
These maps show the area that remained covered by snow from May 01 to Sep 01 over the past three years. It was computed from Theia Sentinel-2 snow products at 20 m resolution to capture the smallest snow patches.
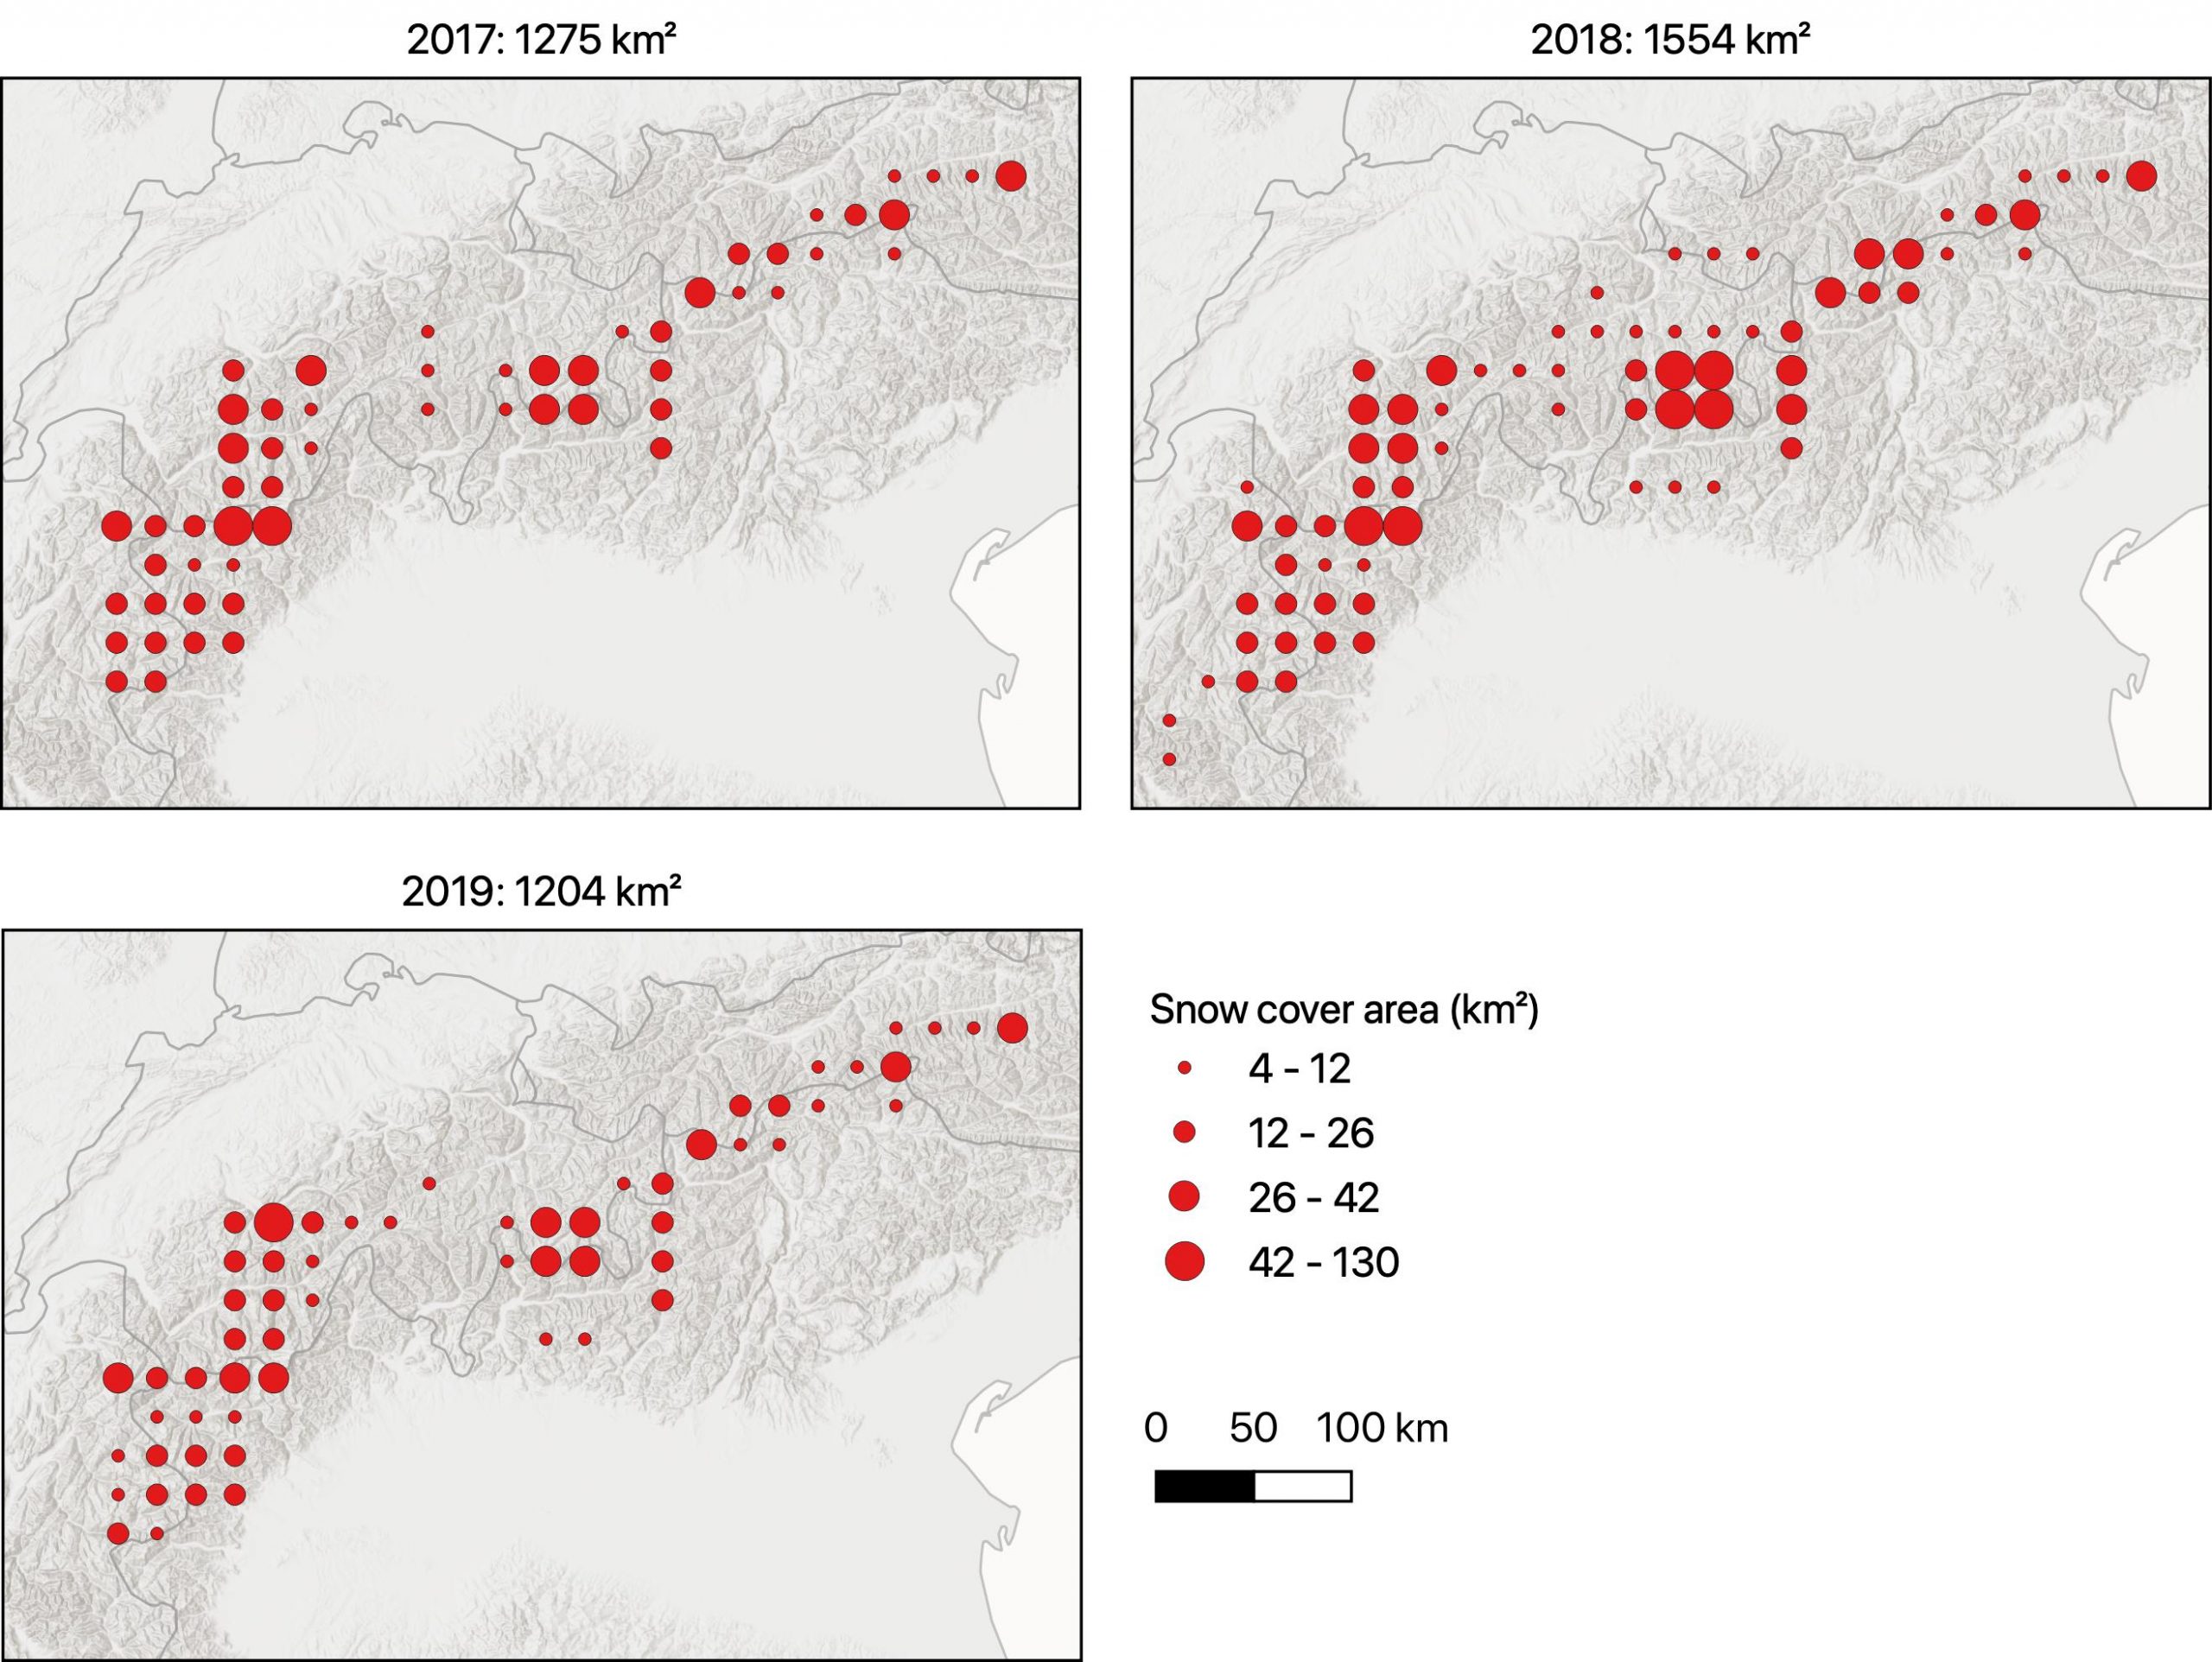
In average there are about 1300 km2 (Lake Geneva: 680 km2) which remain snow-covered until September (less than 1% of the Alps, depending on the definition of the Alps). The persistent snow cover area was highest in 2018, reflecting the exceptional snow accumulation in west Europe mountains this year.
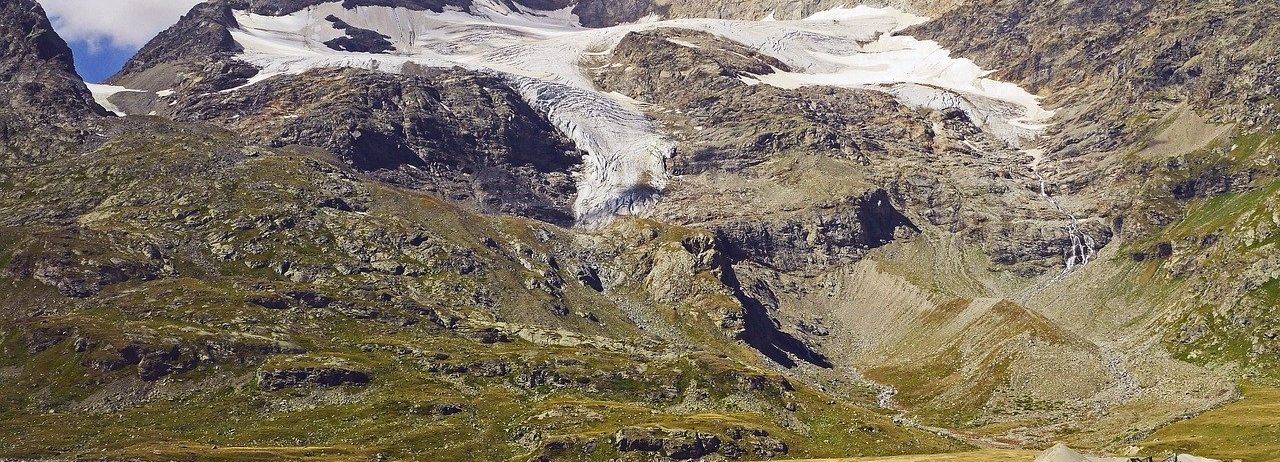
The spatial distribution of the persistent snow is stable from one year to another. In fact, it is mostly found on glacier, as shown here over the Bernina range near St Moritz for 2018.
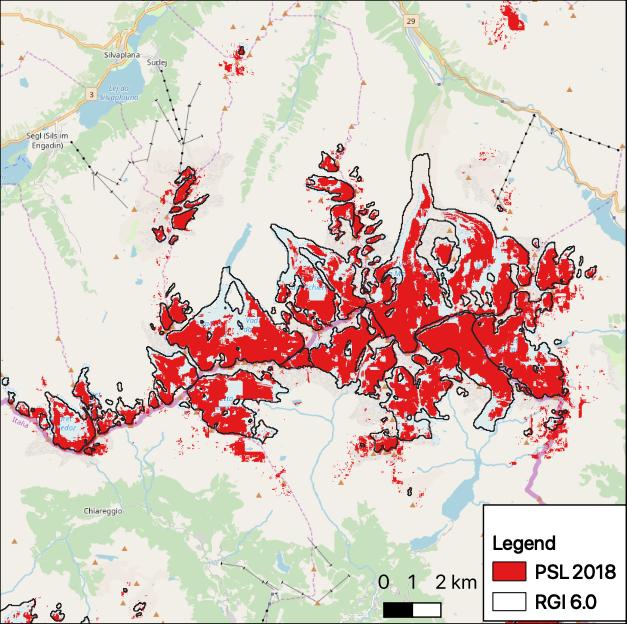
This is expected: in places where the snow cover does not melt before the end of the summer, the snow mass will increase and start to flow, forming a glacier.
For the next Snow & Ice Copernicus service, the European Environmental Agency requested the distribution of a map indicating the permanent snow line (area) for each year. The algorithm to compute this layer called « PSL » is straightforward (see the script in the LIS repo). The PSL is given by the pixels which have a snow cover probability equal to one over a hydrological year, i.e. pixels which were always detected as snow or cloud/no data. Because the snow detection can fail during the winter season due to shadows in steep slopes, and also to save CPU time, we reduced the period of computation to May 01 – Sep 01 instead of the entire hydrological year.