20 m resolution snow maps, why bother?
« Snow varies. » (Snow scientist proverb)
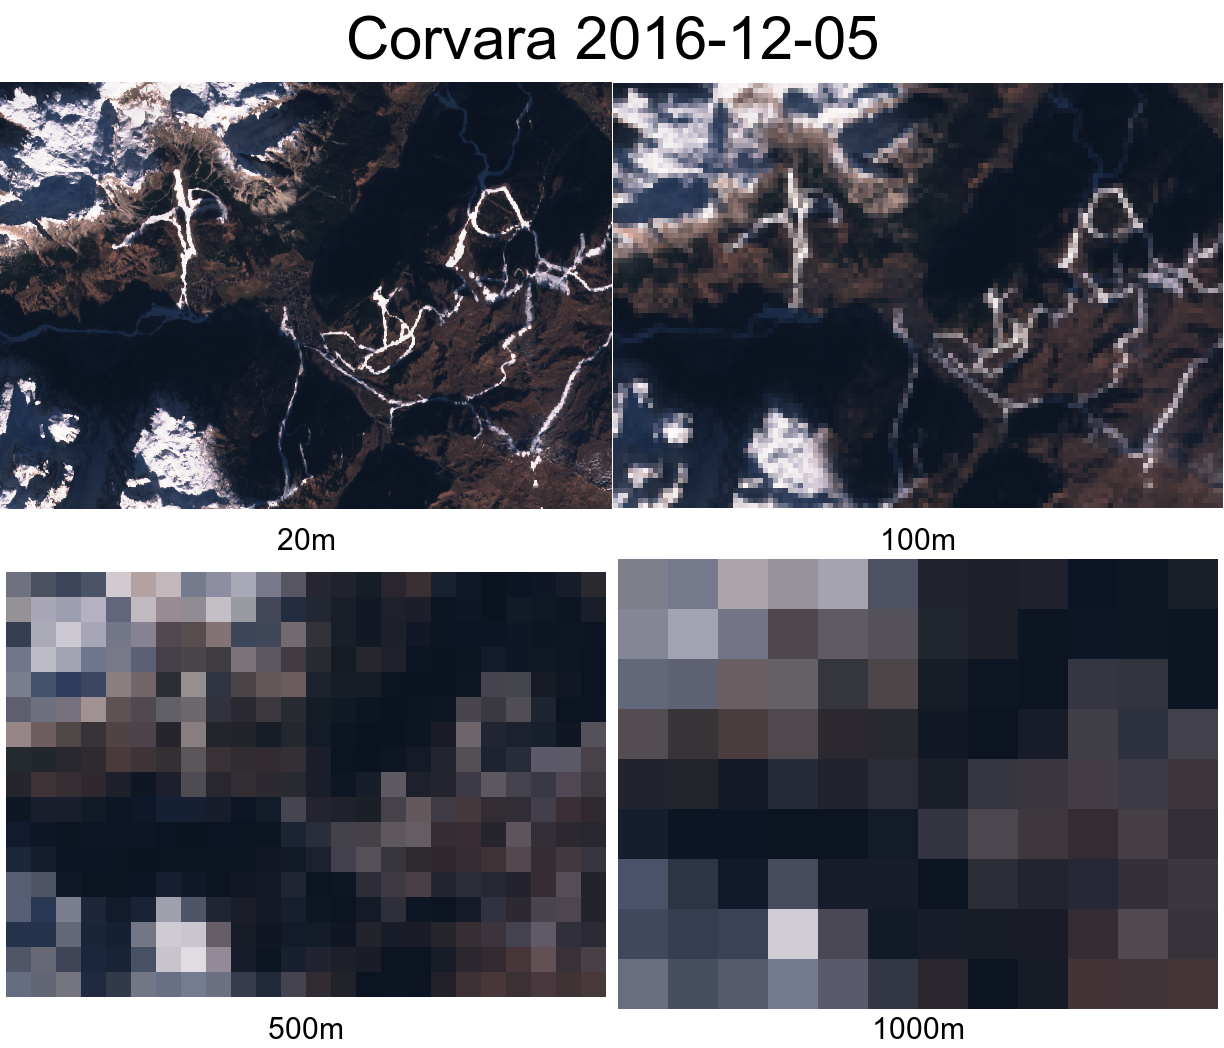
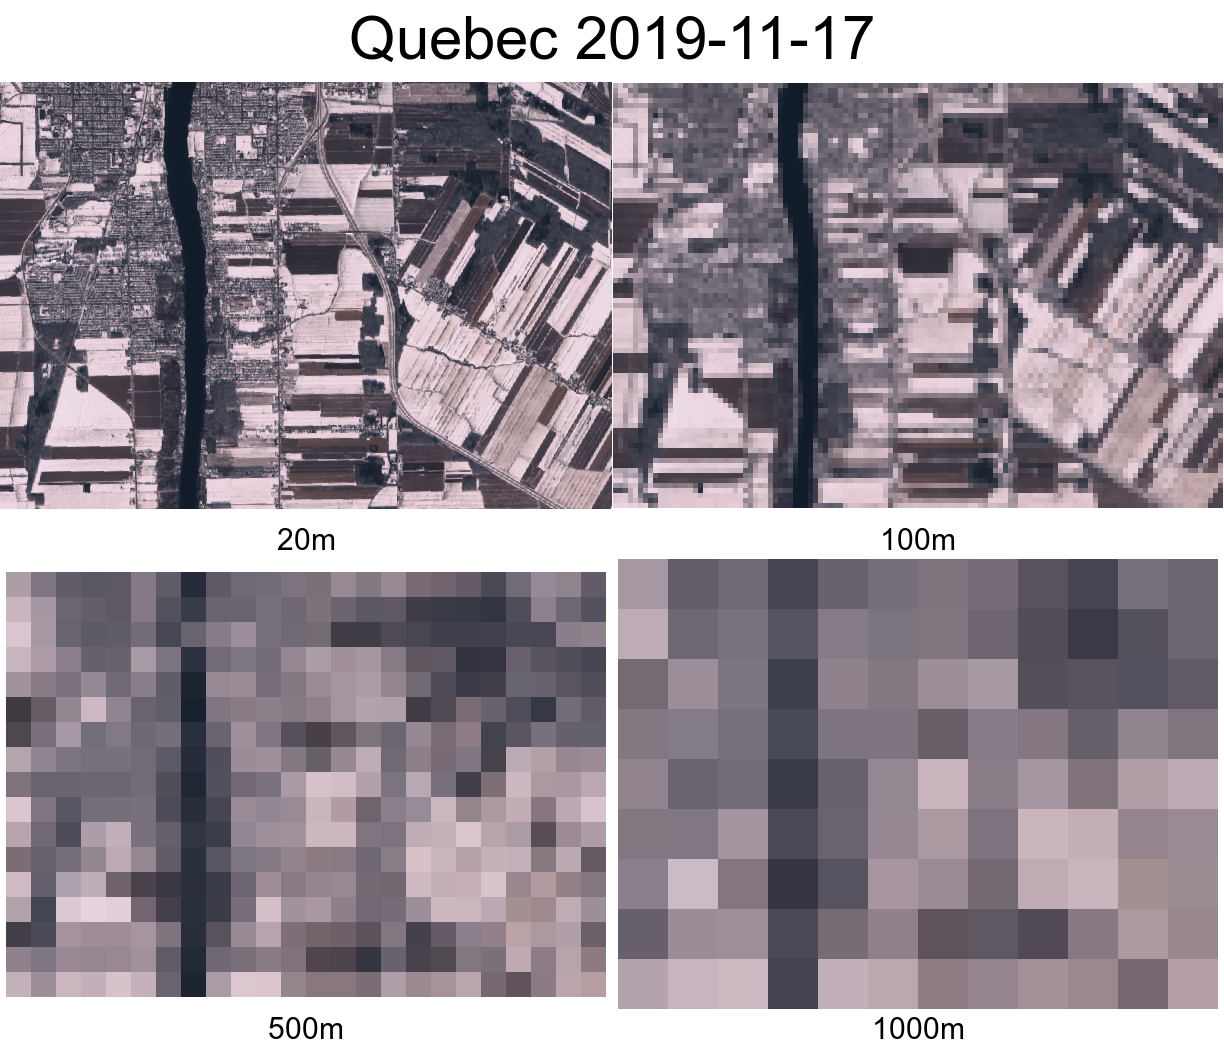
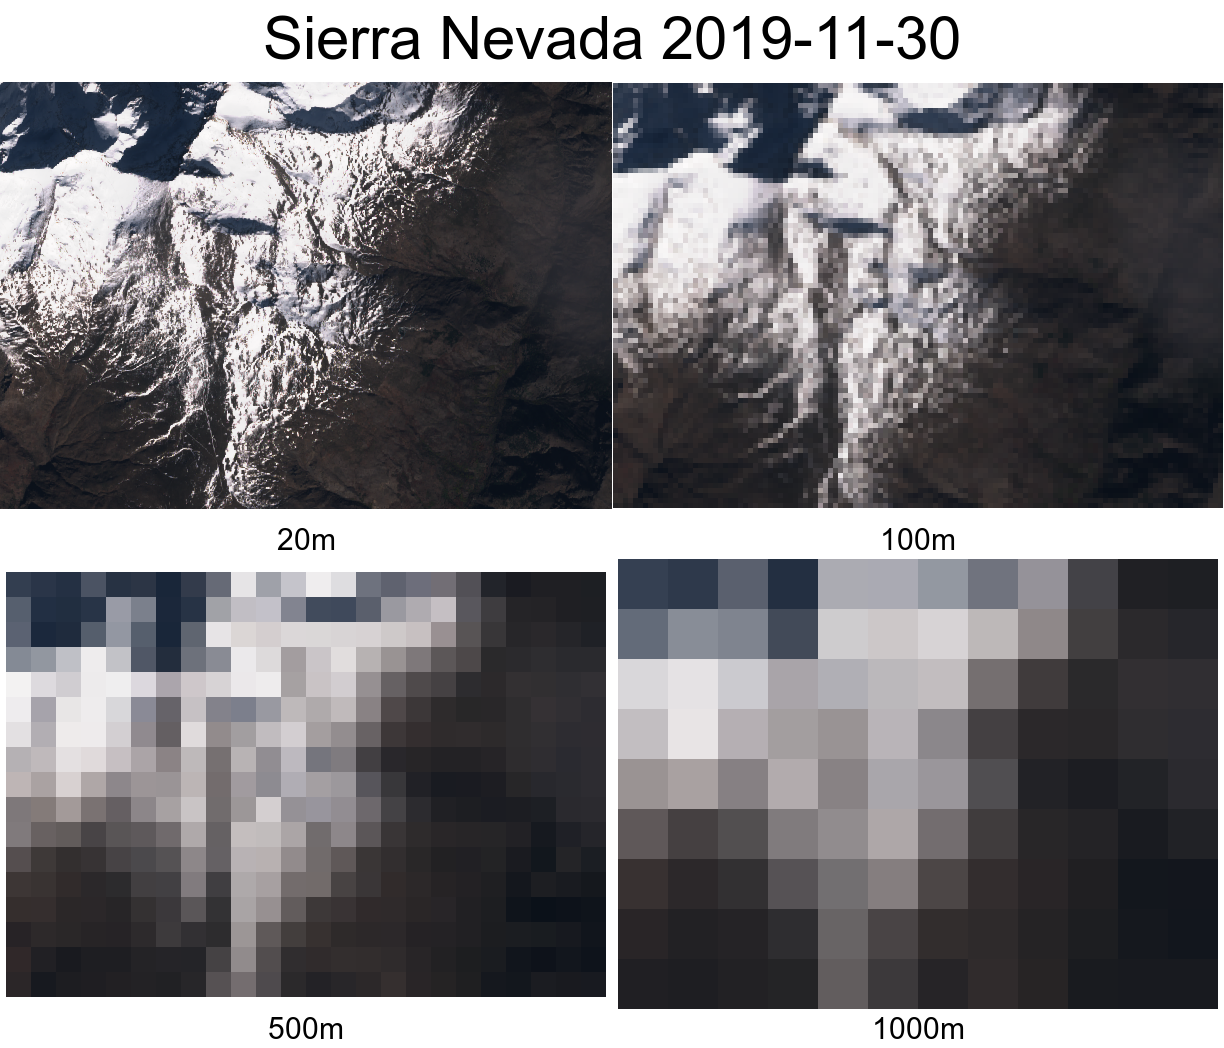
Sentinel-2 enables to generate snow maps at 20 m spatial resolution. But what’s the use of such high resolution snow maps? Because one picture is worth a thousand words, I resampled some Sentinel-2 images of snow-covered regions to coarser resolutions using the average reflectance of the contributing pixels. I did not use snow maps but true color Sentinel-2 composites to better show the context of the selected regions, but it should be easy to mentally compute the snow maps from these examples. The 500 m resolution is close to the resolution of MODIS, Sentinel-3, VIIRS.
First example, a ski resort in the Dolomites, Corvara (Italy).
Second example, urban and agricultural landscape in Saint-Jean-sur-Richelieu, Quebec (Canada)
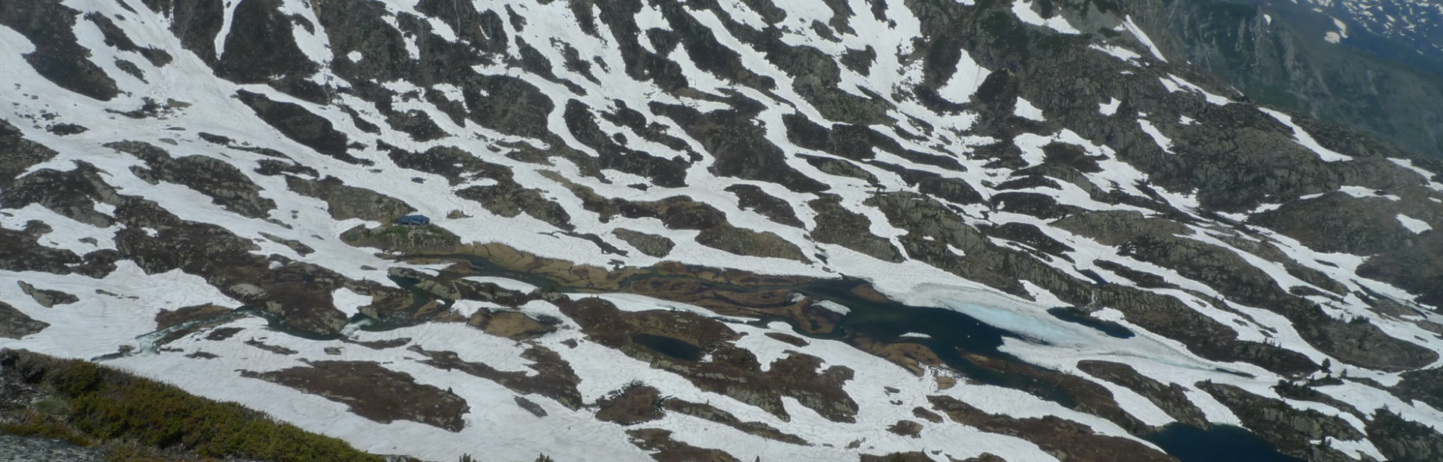
Third example, in the Sierra Nevada National Park
There are better arguments in the scientific literature. In hydrology, the spatial variability of patchy snow cover area has an impact on the melting rates [1]. In ecology, the spatial patterns of the snow cover duration at high resolution is an important predictor of the plant biodiversity [2]. The drawback of high resolution snow maps is the high computing cost to process them. However, previous studies have shown that snow reanalyses assimilating 90 m resolution maps of the snow cover fraction can be done at the scale of entire mountain ranges [3].
References
- Liston, G.E. (1995) « Local advection of momentum, heat, and moisture during the melt of patchy snow covers. » Journal of Applied Meteorology 34.7, 1705-1715.
- Carlson, B.Z.; Choler, P.; Renaud, J.; Dedieu, J.P.; Thuiller, W. (2015) Modelling snow cover duration improves predictions of functional and taxonomic diversity for alpine plant communities. Annals of Botany, 116, 1023–1034.
- Margulis, S.A.; Girotto, M.; Cortés, G.; Durand, M. (2015) A particle batch smoother approach to snow water equivalent estimation. Journal of Hydrometeorology, 16, 1752–1772.