Sentinel-2 L2A (MAJA) and L3A (WASP) products, produced by DLR, available over Germany as WCS
In September 2019, the German Aerospace agency, DLR, started delivering Level-2A products (surface reflectances with a good cloud mask), using the MAJA L2A processor, to which DLR contributed with CNES and CESBIO. The system received a major upgrade recently: it now includes L3A data (seamless monthly syntheses generated with our WASP processor), and both L2A and L3A are accessible with a browser and a WCS interface (but don’t ask me how WCS works, or even better, please explain !). If you are old fashioned as I am, you may also download the data.
If you want to discover the L2A products, use the following link : https://geoservice.dlr.de/web/maps/sentinel2:l2a:maja, while for the L3A products, use the following link : https://geoservice.dlr.de/web/maps/sentinel2:l3a:wasp
And finally, to download L2A, use https://download.geoservice.dlr.de/S2MAJA/files/, data are sorted by tile number, and then year, month and date.
Here is a nice example of a level 3A mosaic is provided below, with a zoom to DLR Oberpfaffenhofen site, near Munich, where the Earth Observation Center (EOC) is, and where Pablo d’Angelo integrated MAJA and WASP to the EOC production center, and Torsten Heinen integrated it to the EOC Geoservice portal. Congrats to this great team !
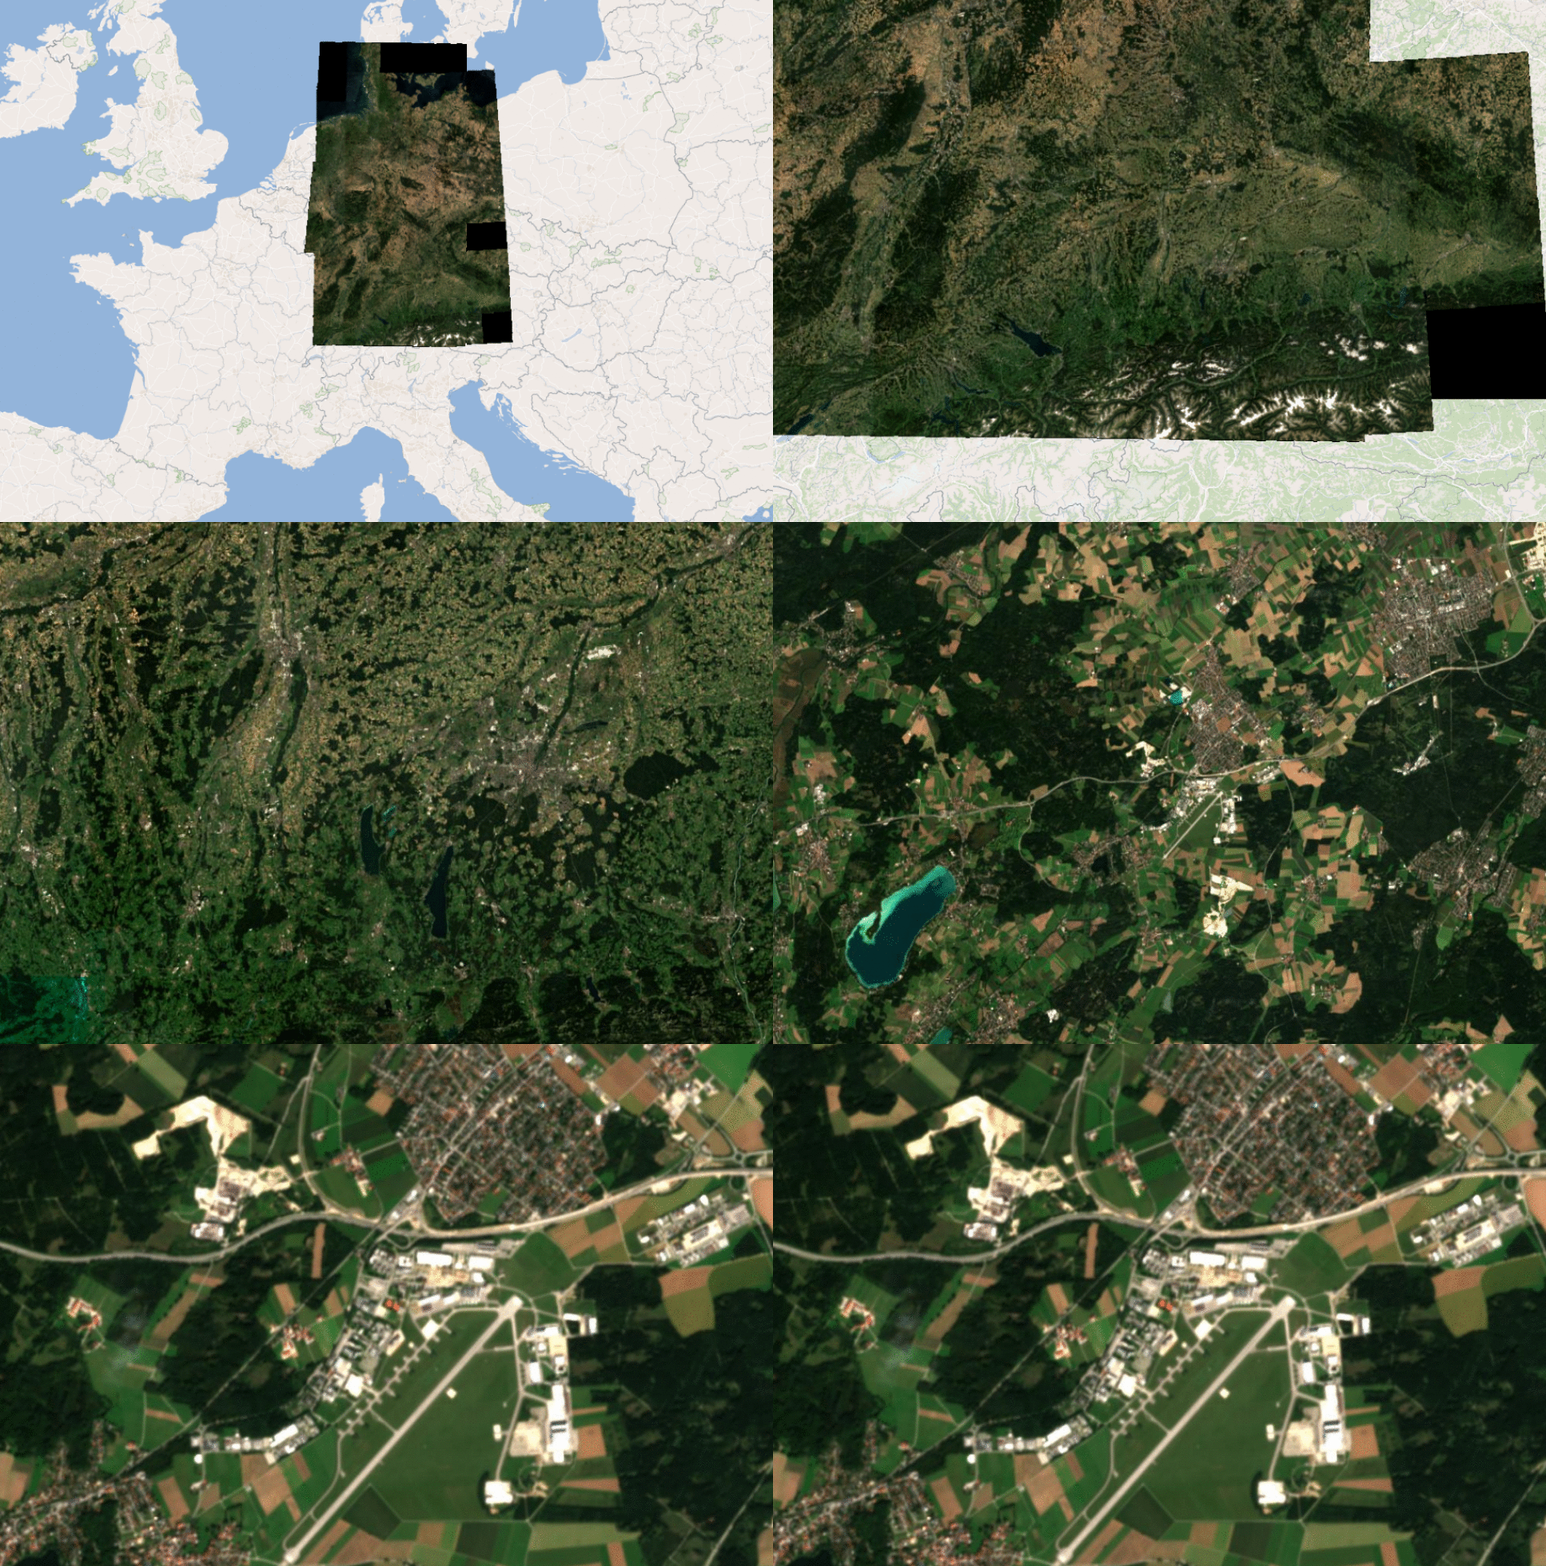
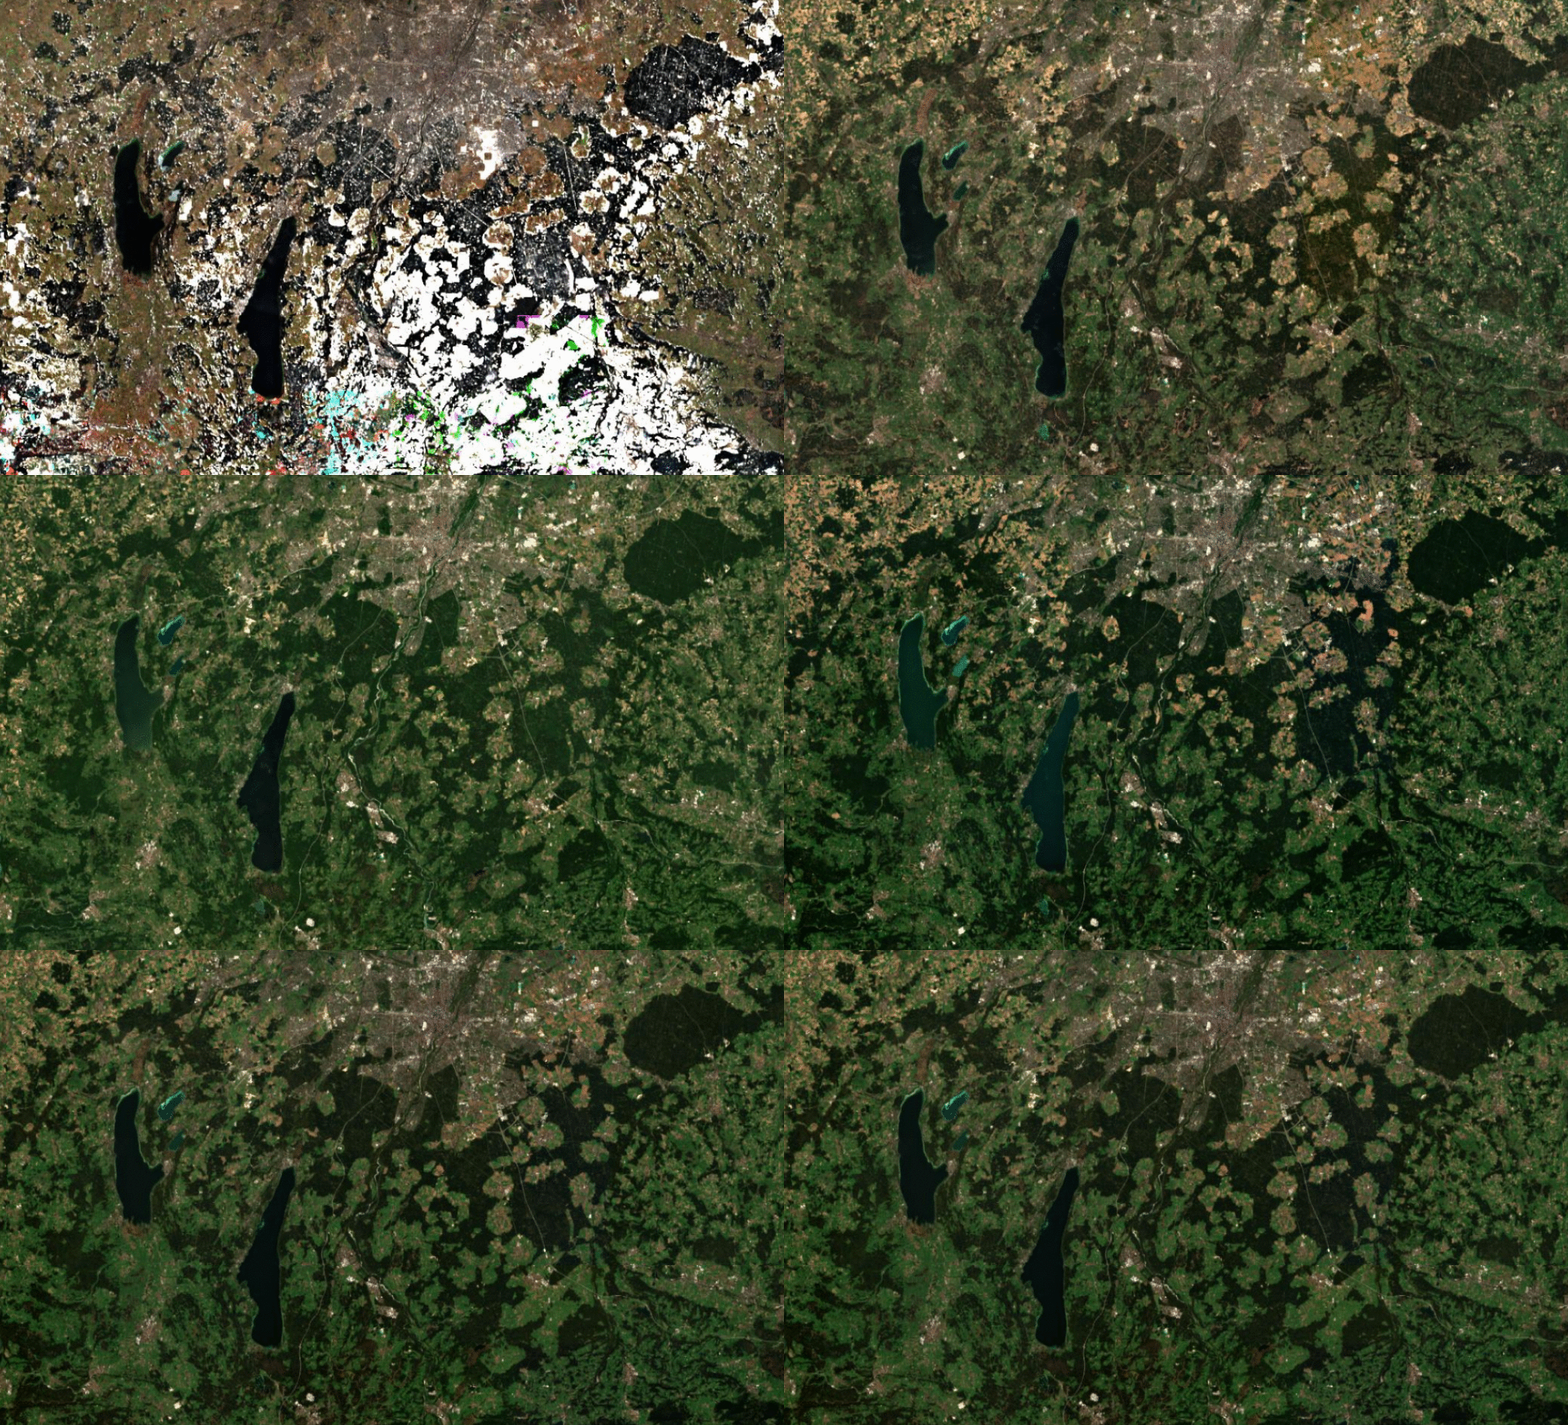
The DLR team produced all the monthly composites since June 2015. At that time, and until July 2017, we had only one Sentinel-2 satellite, and the data gaps due to clouds are much more frequent. In 2019, Germany was almost cloud free throughout the whole year, except the winter months. Here is an animation over South Bavaria from February to October 2019, Munich is at the centre top of the image.
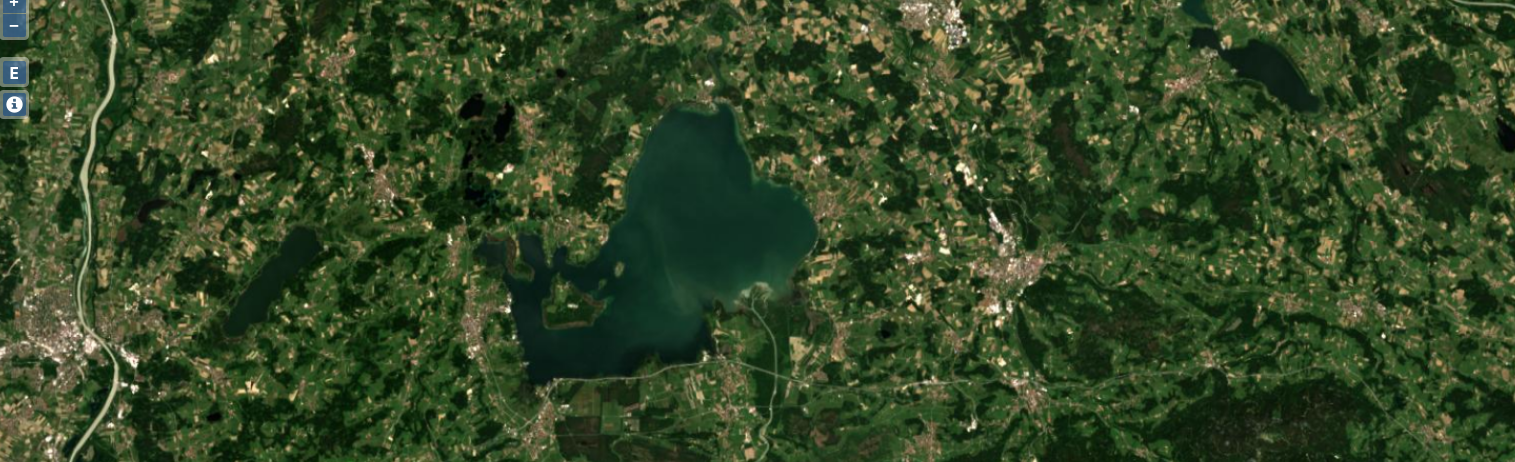
What I also like a lot with the representation chosen by DLR is the possibility to select two annex data sets provided with the syntheses, the flags and the averaged dates (click on images to zoom). This representation should be very useful, and I should do the same in my own representation. You may notice that the extension of flagged pixels is greater than the extension of apparently cloudy pixels. When a pixel has been cloudy for the whole period, WASP provides the minimal reflectance in the blue, which tends to select the thinnest cloud cover.. or the thickest cloud shadow.Moreover, as we perform a cirrus cloud correction, some of the clouds may disappear, but we are not confident enough on the correction to unflag these pixels.
Some coloured artefacts still appear in the level 3A where tiles overlap. This is a bug which is not present in the syntheses, but only in the viewer. DLR colleagues are currently hunting for that bug.
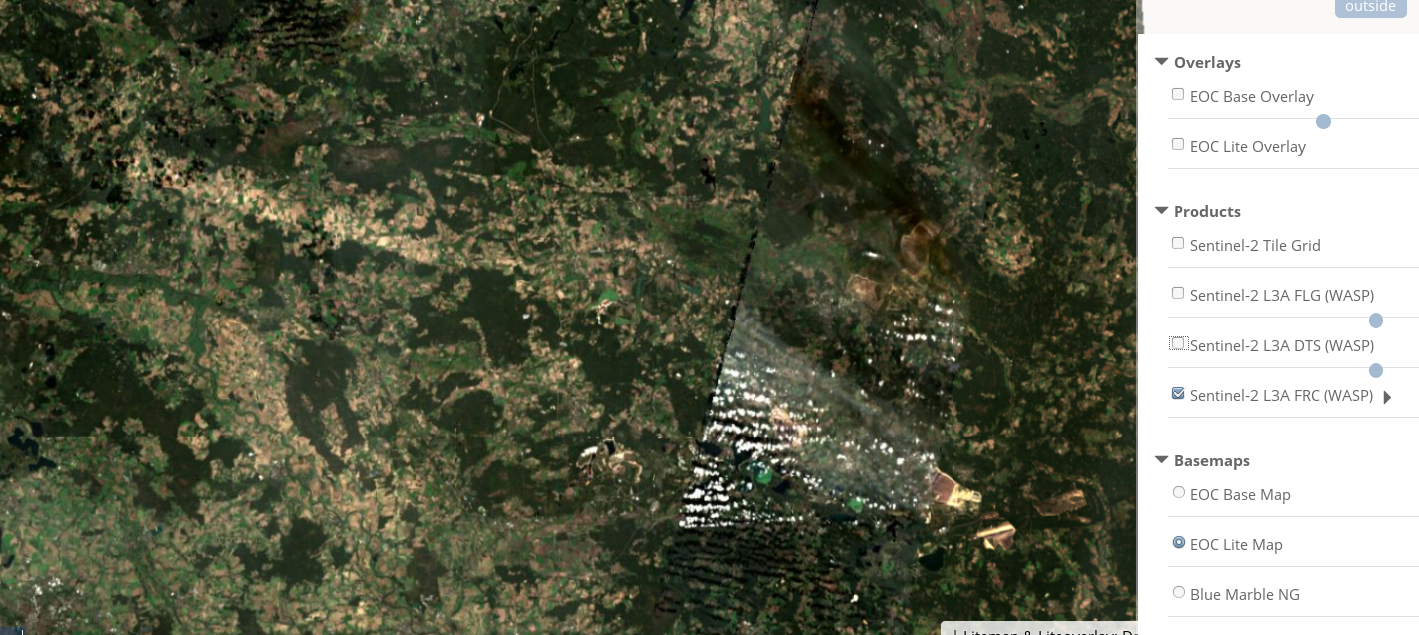 | 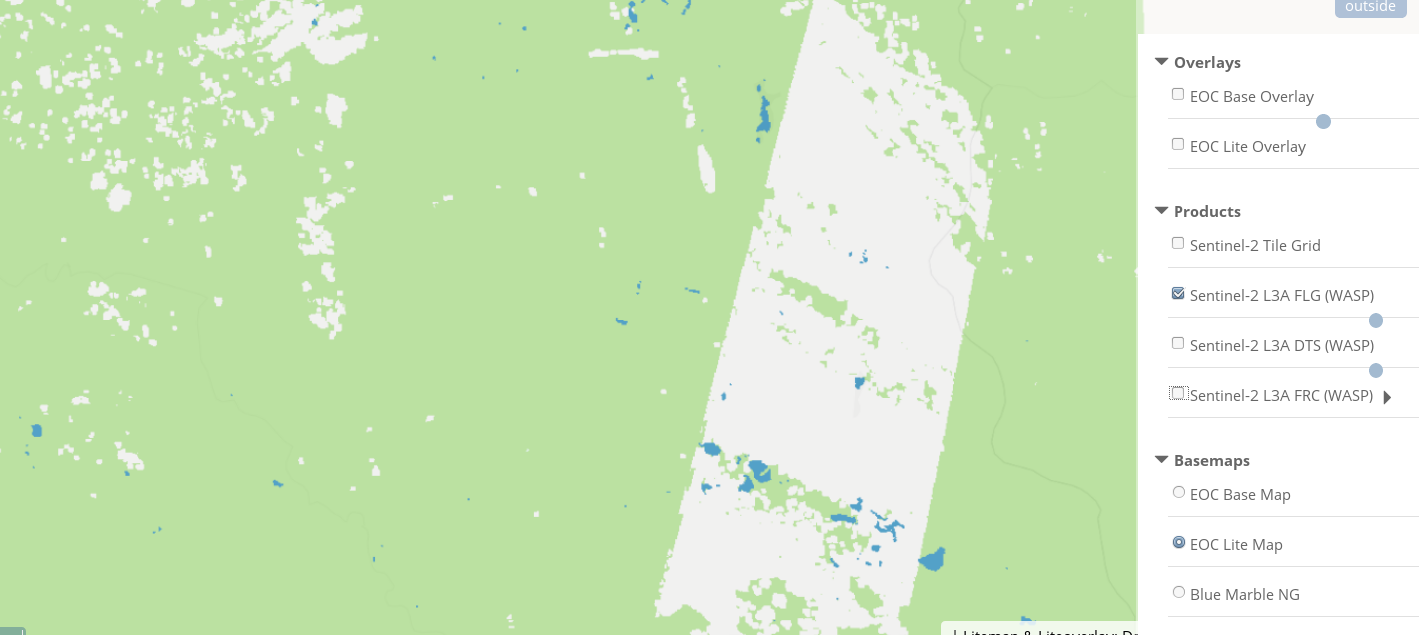 | 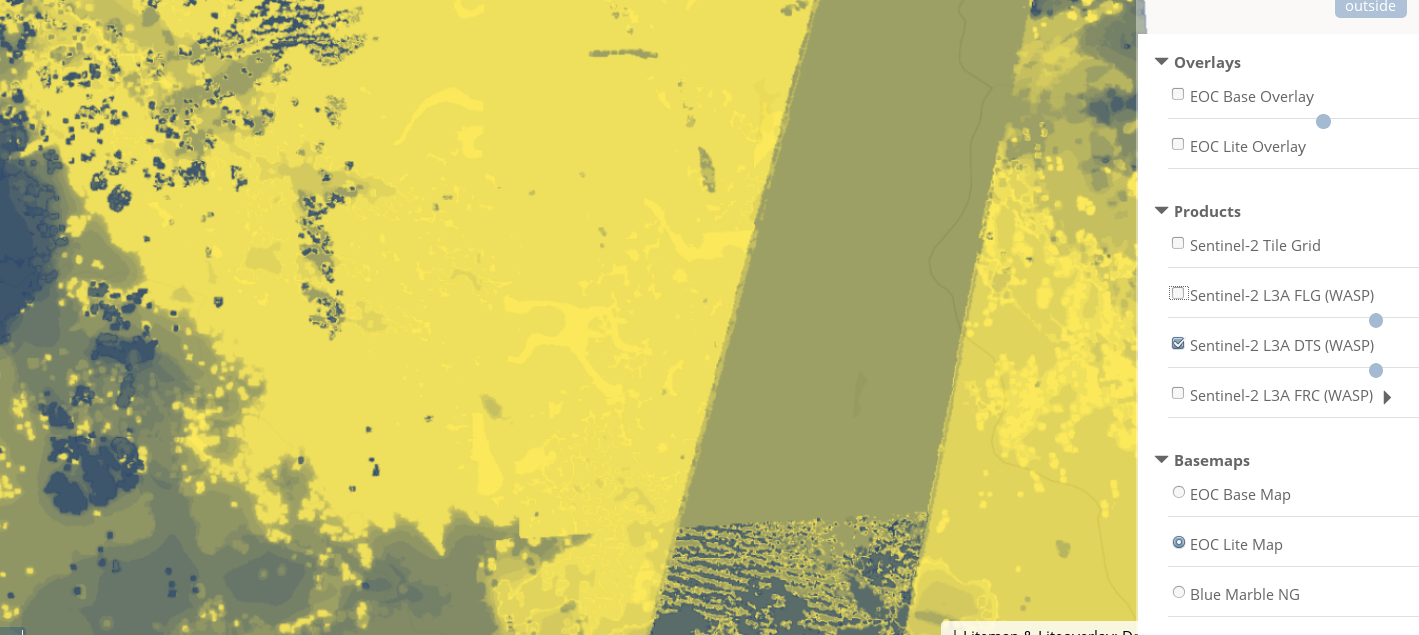 |
| Weighted average surface reflectance, Nov 2019, with some remaining clouds | You may check that these clouds are flagged as such | This filed gives you the weighted average of dates, which may vary significantly within the image |