Our blog’s audience in 2018
A seventh year begins for the « Séries temporelles » blog, and as usual, it is an opportunity to review its audience, and to get a little self-satisfaction. We usually publish this post early January, but it seems there was no January this year (or was I too busy ?). The blog is still receiving more visits every year, with a sharp growth this year : +35% of visits …
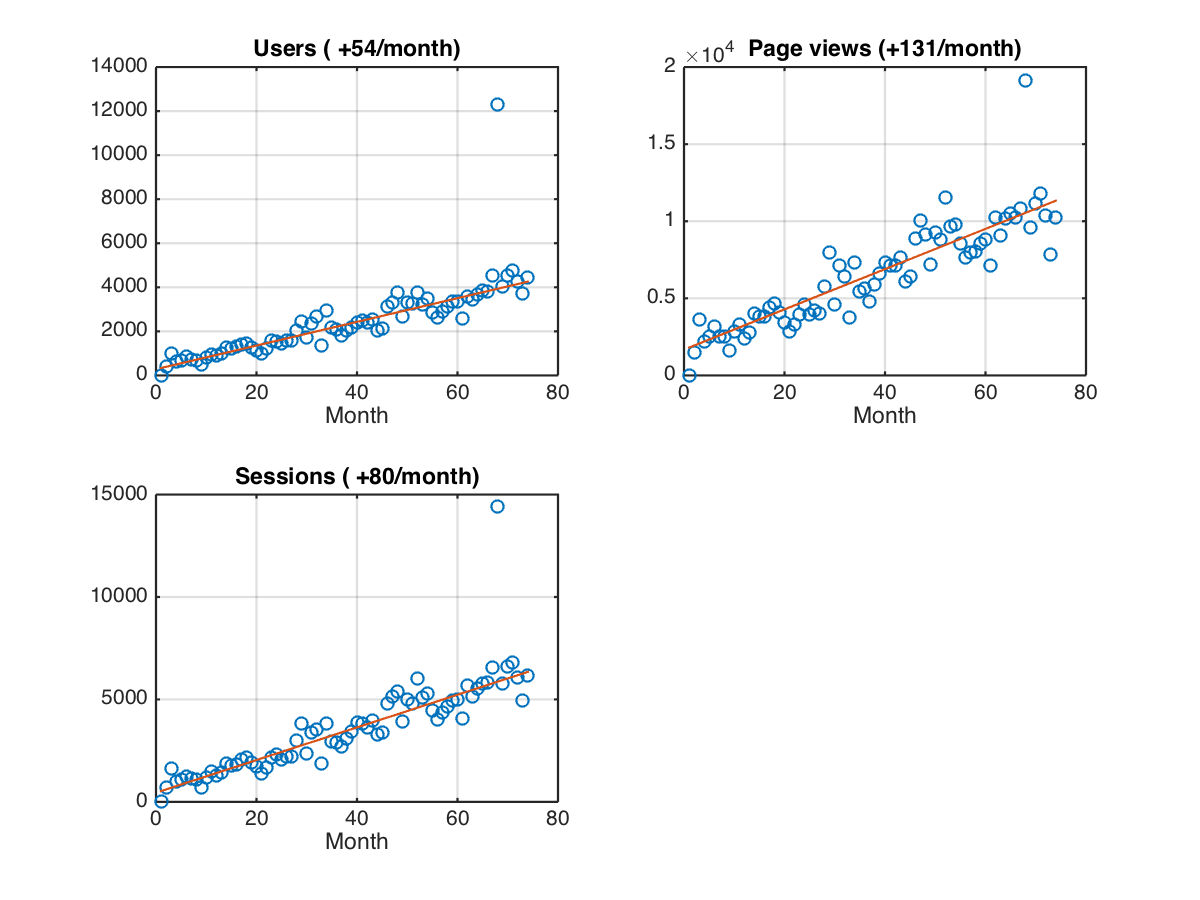
So, if we look at the trends on the plots above, the audience growth is remarkably linear, but if we sum-up everything per year, we see a sharp increase. The cause is that outlier in the top-right corner or each graph above, related to a big buzz in Japan for SImon’s article about Xe-Namnoy lake dam failure in July, that flooded several villages, and killed too many people.
| 2013 | 2014 | 2015 | 2016 | 2017 | 2018 | |
| Number of visits | 13985 | 22928 | 34723 | 47773 | 57692 | 79243 |
| Number of viewed pages | 30922 | 46940 | 66947 | 89555 | 105846 | 131846 |
French visitors only counted for 25% of visits, much less than the other years. Japan ranked second with 16%, United States ranked third, followed by European countries (UK, Germany, Italy, Spain) and by India, Canada and Morocco.
In 2018, contrarily to the other years, the authors list is very short, 95 % of the posts were written either by Simon Gascoin, who is specialized in catastrophies, hydrology and snow (which are often related), and myself, about optical data quality, Sentinel-2 and Theia’s news. But we welcomed two new authors, Gerard Dedieu, who tells us about the Venµs satellite, and Vincent Thierion, about land cover, and Jordi Inglada contributed a few articles about machine learning. We are still missing an author to tell us about the results obtained with Sentinel-1 at CESBIO. This blog is open, writing a post does not take long (the first one always more than the second and third ones), and we are waiting for you to contribute, even if you are not a CESBIO member. If you are a user of remote sensing time series, especially those from Theia, please tell us about your findings, results, hopes and regrets. Here are the top ranking pages, after having removed the tags, author names, article lists, and summed French and English versions…
What can we tell from that ?
- There was a huge buzz in Japan about Xe-Namnoy lake dam failure. We guess it comes from a highly visible website, which recommended this article (but our japanese is not fully fluent)
- The practical pages (download tools, codes, formats) , and the « how it works » series hold most of the first ranks
- Blog articles reporting an event may be momentarily successful, but their reading does not last too long, except if it is about GEE
- As for last two year, the example of using Google Earth Engine, published in 2016, attracts much more than articles that warn about its dangers (it’s sad). As Simon said, we would have to quote GEE into each article title to get more traffic.
- Some pages in French have a higher attendance than their English translation, especially those on land use in France, which is normal. But this is also the case of ortho-rectification. Why ?
- The MACCS / MAJA description pag
e is often visited, but I believe that 95% of my articles contain a link to this page …