Sentinel-2 reveals the surface deformation after the 2025 Myanmar earthquake

Sentinel-2 captured several clear-sky images of Myanmar before and after the 28 March 2025 earthquake. The animation below shows a 5-day apart sequence of images captured by Sentinel-2B and Sentinel-2C (10 m resolution) near the epicenter located close to Mandalay.

The surface slip due to the earthquake follows the Sagaing Fault, a major fault in Myanmar, and extends over 500 km (!) according to Bradley and Hubbard. They used Sentinel-1 and Sentinel-2 to map the offsets but the method is not explained and their results look a bit different than another analysis posted by Zixin Lee using Sentinel-2.

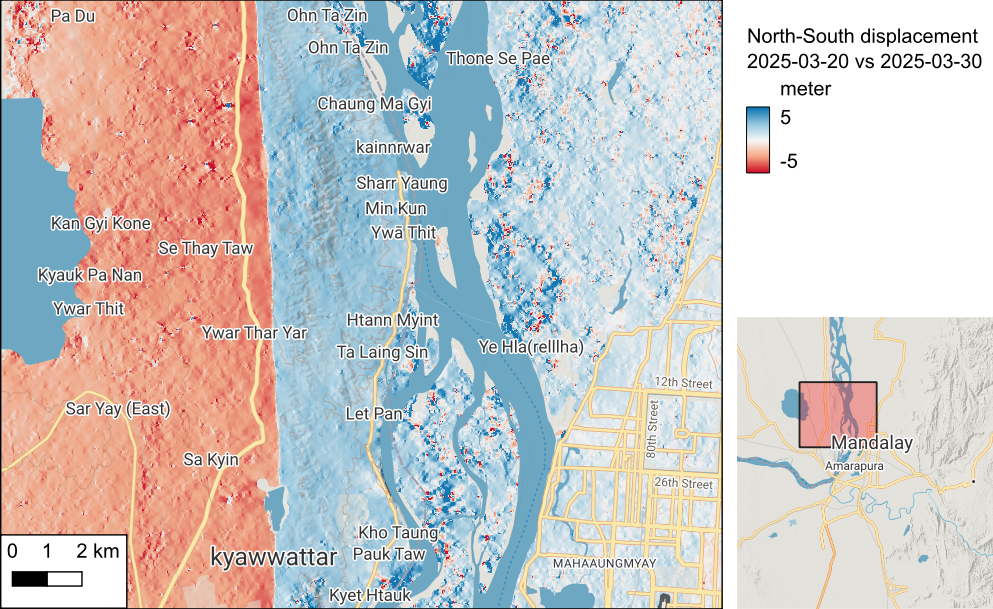
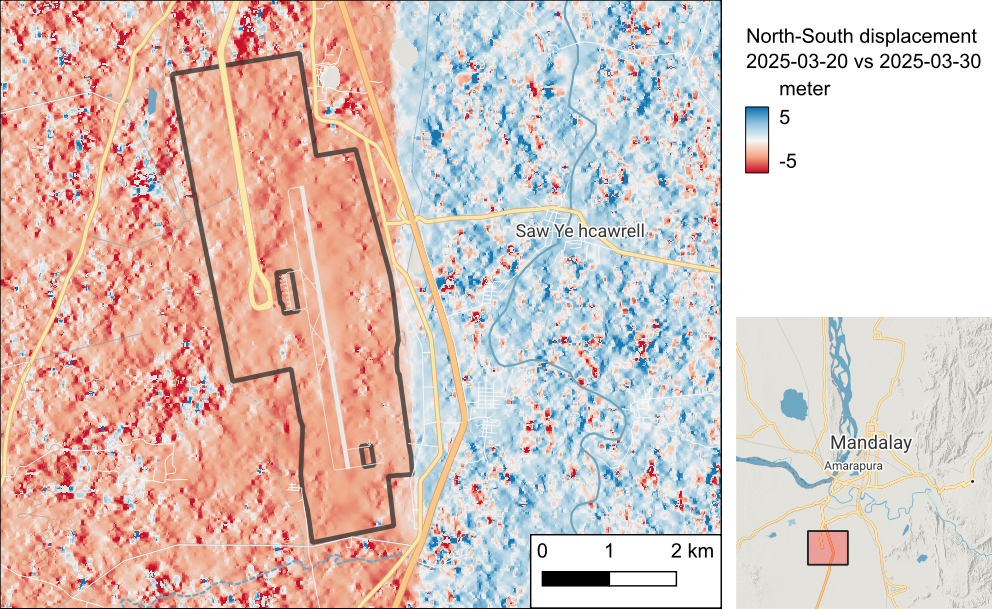
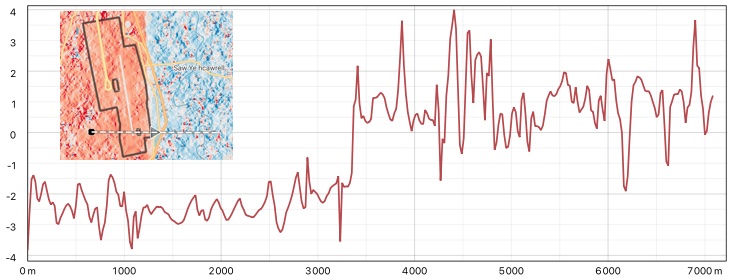
This prompted me to perform my own analysis. I selected the pair of Sentinel-2B images acquired on 20 and 30 March 2025 (same sensor, same orbit, same acquisition geometry) near Mandalay. I used the MicMac software through the online GDM-OPT service with default parameters (band B04, window size 5×5, correlation threshold 0.2). The output shows a very sharp surface slip in the north-south direction.

Blue pixels moved southward and red pixels moved northward

North-South displacement near Mandalay airport (black polygon)
East-west profile of the north-south offsets across the Mandalay airport (y-axis in meters). Negative offsets mean northward displacement.

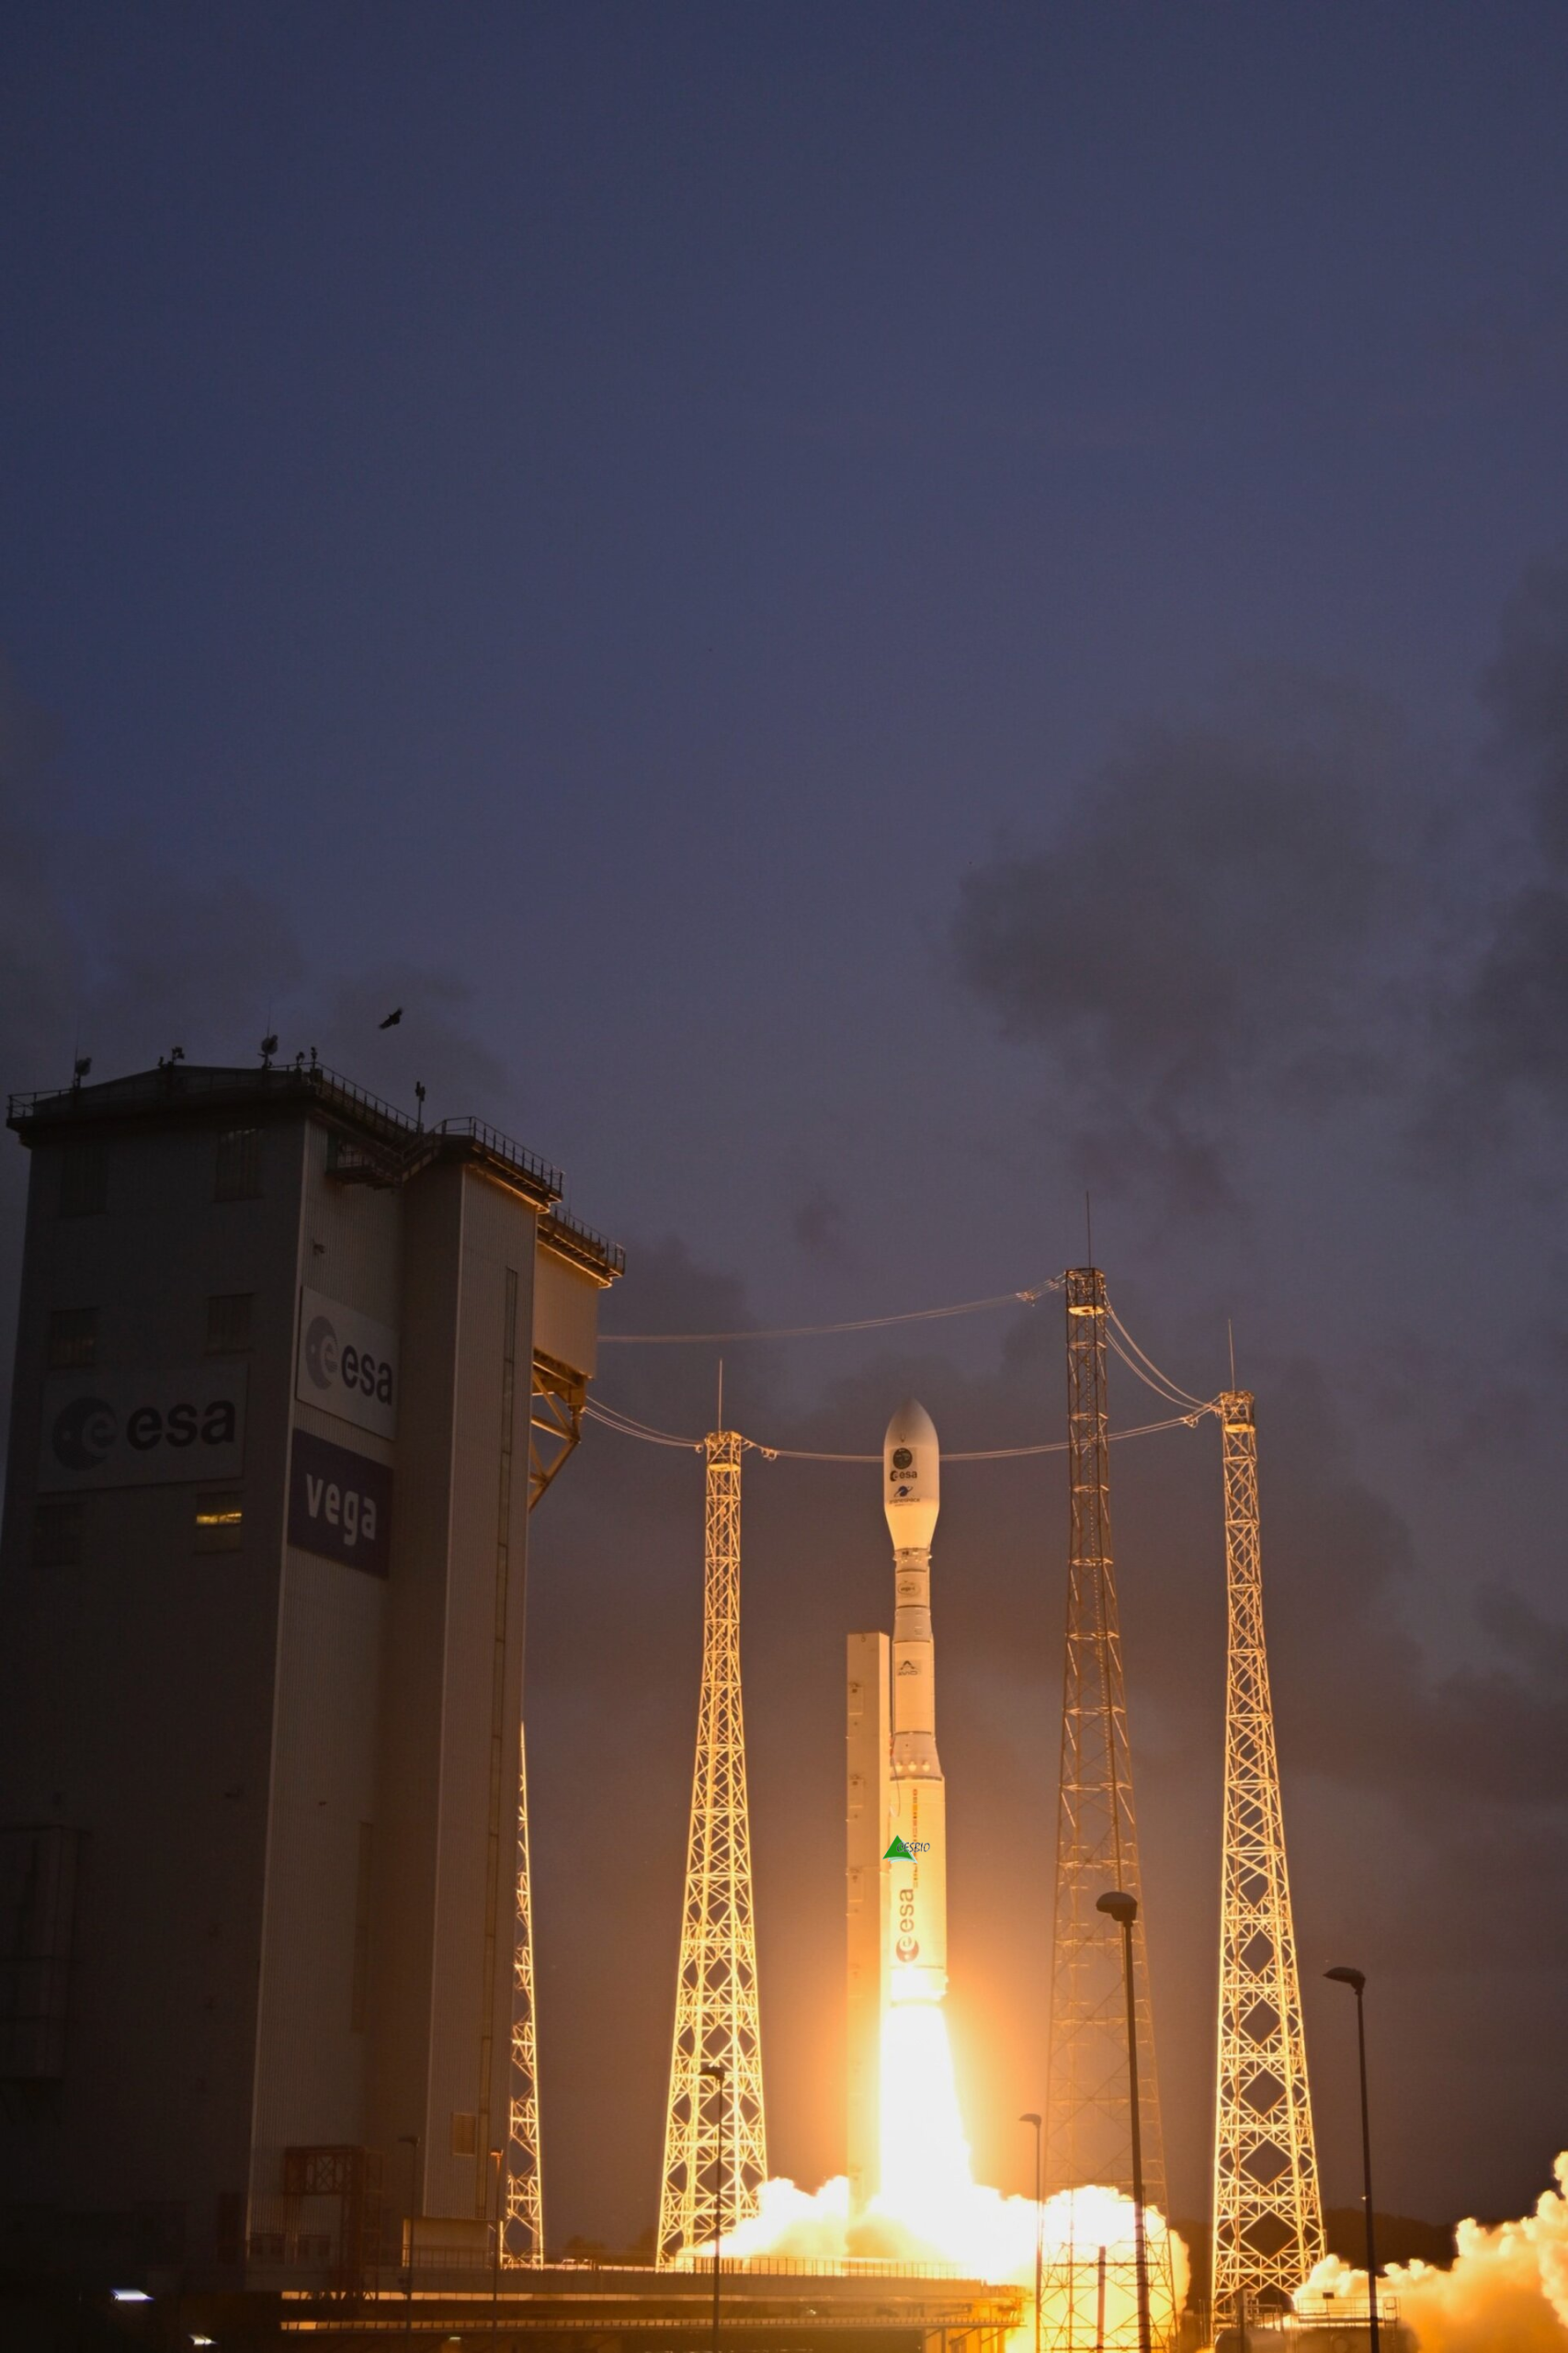
Thanks to ESA (and Olivier), Sentinel-2 is a now a constellation of three satellites, which enhances the availability of Sentinel-2 observations.

Data available here: Ground surface displacement maps of the 2025 Myanmar earthquake [Data set]. Zenodo. https://doi.org/10.5281/zenodo.15127866

Update on 03 April 2025: Other more extensive analyses were posted by Max Van Wyk de Vries and by Floriane Provost.

Plus d'actualités

Dates de fauche en France

En 2024, des collègues du Cesbio ont publié un article* sur la cartographie de la date de fauche en France en 2022 à partir des données satellitaires Sentinel-2.   Leur magnifique figure 10 a attiré mon attention. La version à haute résolution fournie avec l’article (2861 × 2911 pixels) correspond à une image dont les pixels font […]

Évolution du jour de déneigement dans les Alpes françaises et les Pyrénées

Les socio-écosystèmes des Alpes et des Pyrénées dépendent étroitement des fluctuations annuelles du manteau neigeux. En particulier, le moment de l’année où la neige disparait détermine le début de la saison de croissance de la végétation de montagne et donc la période des estives. Le changement climatique est en train de bouleverser ce rythme saisonnier. […]

Evolution de l’altitude de la ligne de neige au cours des 41 dernières années dans le bassin versant du Vénéon (Oisans)

Pour contribuer à caractériser les conditions hydrométéorologiques lors de la crue torrentielle qui a frappé la Bérarde en juin, j’ai analysé une nouvelle série de cartes d’enneigement qui couvre la période 1984-2024 [1]. Grâce à la profondeur temporelle de cette série, on constate que l’altitude de la ligne de neige dans le bassin versant du […]

Rechercher