Sentinel-2A and Landsat-8 team up to track Kilauea Volcano’s lava flow
Kilauea Volcano in the largest active volcano in Hawaii and one of the most active on Earth. It has been erupting for over 30 years now but hit the headlines recently because a large lava flow traveled up to the ocean, adding 2 brand new hectares to the Hawaiian Islands.
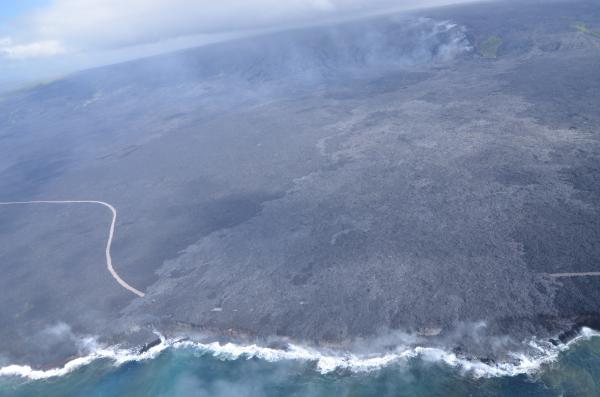
This large lava river originates from a rift on Puʻu ʻŌʻō crater‘s eastern flank. It is made of smooth molten basalt or pāhoehoe. Pāhoehoe lavas flow rapidly because they are very hot, with temperature exceeding 1000°C. Let’s see if we can track this lava flow from space! The photo above shows that the contrast between the new lava and the older lavas is too low to use the satellite imagery in the visible bands (contrary to this giant ice avalanche in Tibet or this massive landslide in Alaska). However, both satellites Sentinel-2A and Landsat-8 observe the land surface not only in the visible part of the spectra but also the shortwave infrared (SWIR) near 2 µm.

Prof. Planck suggests that we should look at the SWIR channel because he claims that in these wavelengths the radiance measured by the sensor should be dominated by the thermal radiation emitted by the hot lava. Following his advice I used the SWIR band as the red band to make RGB color composites of all the Landsat-8 and Sentinel-2A images from early June that were available in the Google Earth Engine:
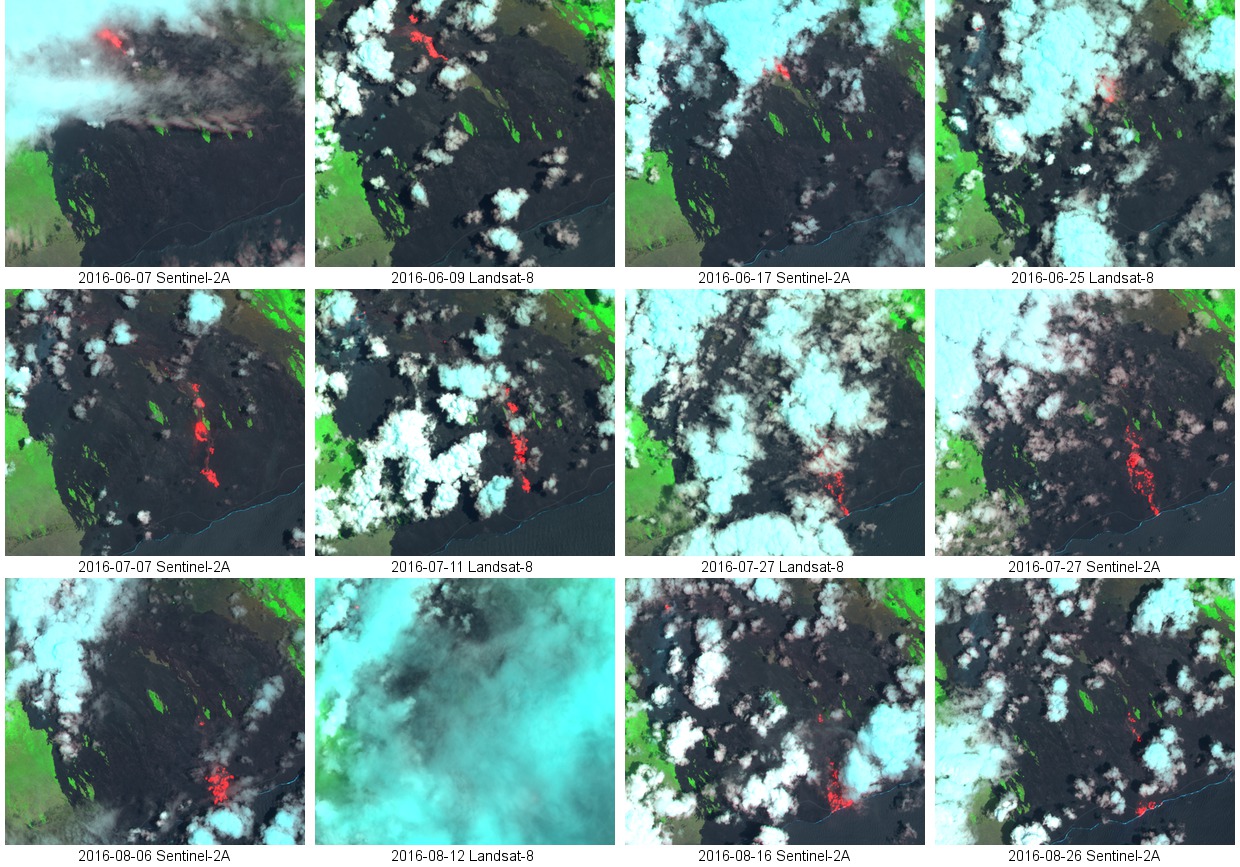
And he was right! The hot lava appears in red while the older, cold, lavas are black. We can discard the Landsat-8 image of Aug 12 (too cloudy) and the Landsat-8 image of Jul 27 (a clearer image was acquired by Sentinel-2 on the same day) and watch the lava moving toward the sea:
It shows that the lava entered the ocean near July 27 in agreement with field observations. On July 27 the USGS Hawaiian Volcano Observatory issued a report stating that « the flow has moved at a rate of about 300 meters per day ». We can also check this based on our satellite images! First I pointed the front of the « red » lava flow on every date. Then I exported this collection of points to UTM coordinates and computed the distance between the points by chronological order.
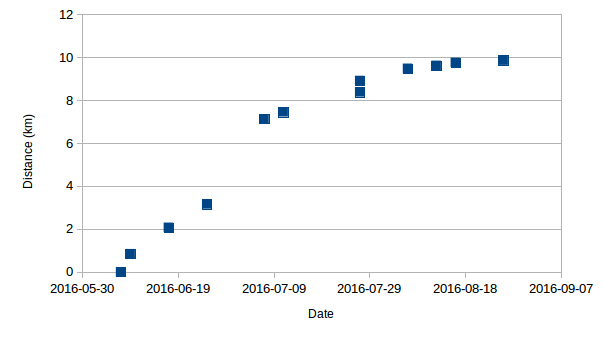
These data indicate that the mean velocity of the lava flow was 130 meters per day (2.4 miles per month), with burst of speed up to 400 meters per day at the beginning of the event. Quite fast, but not fast enough to escape from the EU-US satellites team!