Chambord flooding: An update to « Mapping flooded areas using Sentinel-1 in Google Earth Engine » from Simon
Short after working with Simon on the script for the article about the mapping of flooded areas, I wanted to be sure that our short script was realistic. I had some time to loose at the airport, so, after finding a wifi connection, I looked for pictures of the flooded areas of the north of France. I found some impressive pictures of the damages like the hippodrome of Mesnil Le Roy and surrounding places, but the most stunning one was surely this aerial view of Chambord.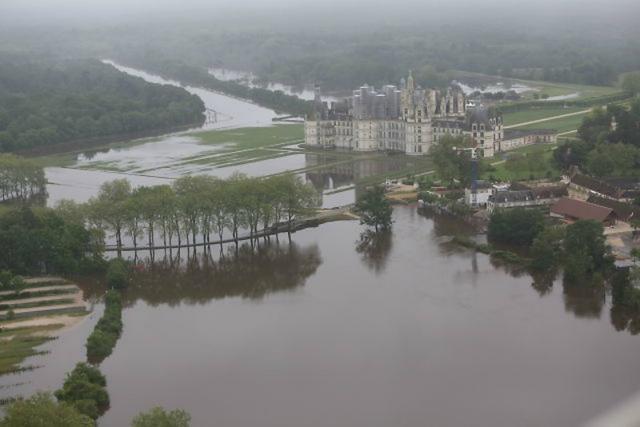 Francis the 1st was the king of France during the first part of the XVI century. After winning the battle of Marignano, he decided to build a castle to its own glory. The castle is actually located 5 km south of the Loire river in between the cities of Blois and Orleans. The small Cosson river also crosses the park as can been seen on the aerial view. The Cosson overflowed at the end of May 2016 causing damages to the castle estimated in between 0.5 and 1 million euros.After doing some slight adjustment to the original script, I exported the result from Earth Engine as a Geotiff file and encapsultated it into a KMZ file to load into Google Earth. Some people had already prepared a 3D model of the castle, so it was quite easy to create this 3D view.
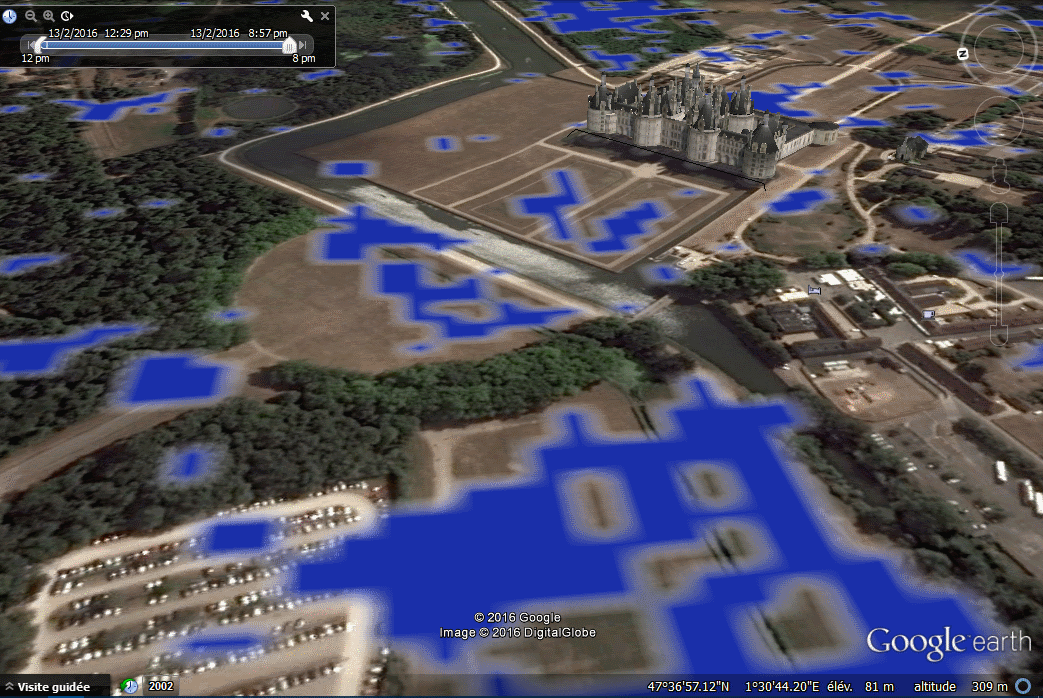 Well, I’m really sorry for King Francis, but it seems our first guess of mapping flooded areas was not bad at all.