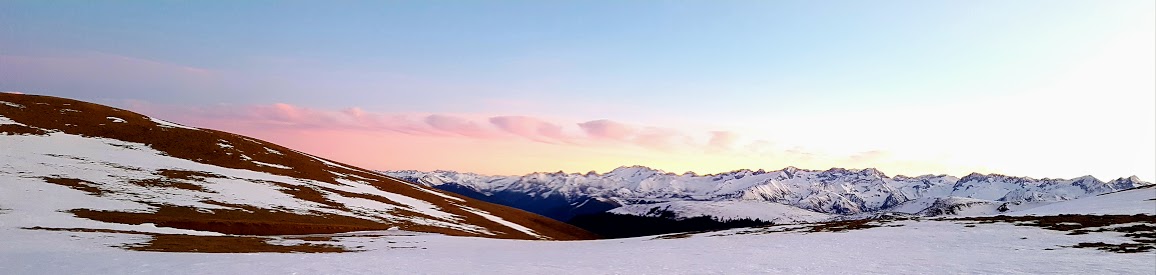
Sentinel-2 also sees grassland taxonomic diversity !
Sentinel-2 image time series are widely used to map land cover, see for instance here or here. However, they can be used to extract other relevant information about the observed landscapes.
In a recently published article (https://doi.org/10.1016/j.rse.2019.111536), we have used fifteen months of Sentinel optical and radar data to predict taxonomic and functional diversity at the pixel scale.
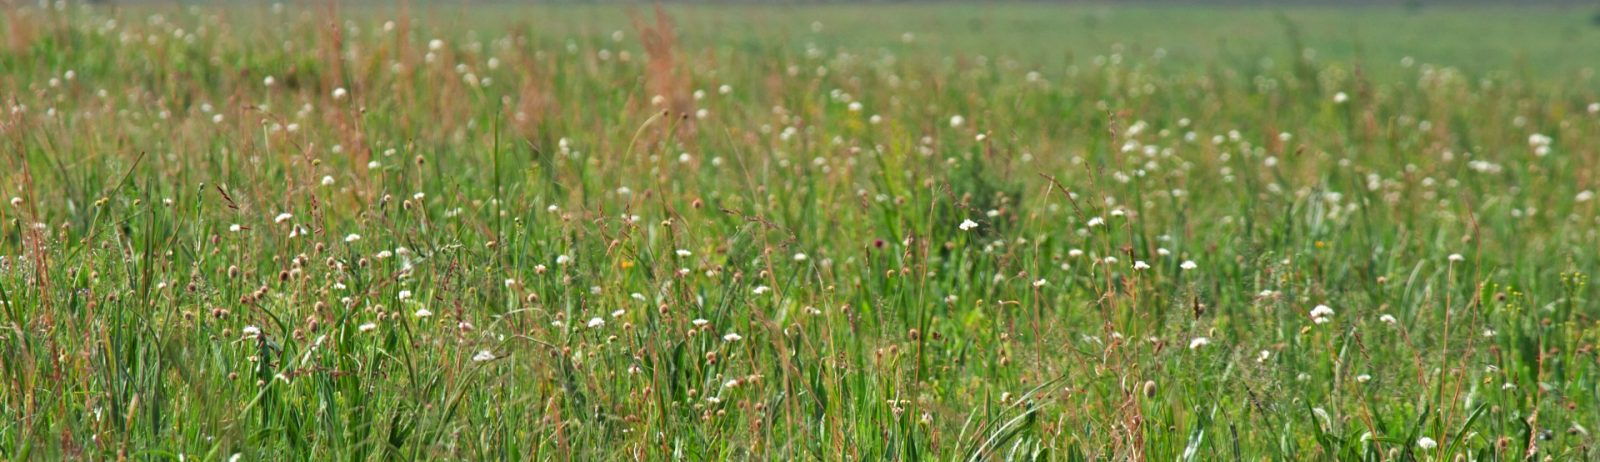
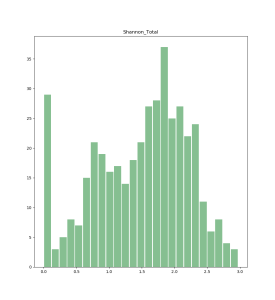
We conducted field survey on various type of grasslands (from semi-natural to temporary ones) to collect plant diversity. The figure below shows the histogram of the Shannon index. A high Shannon index value indicates high biodiversity.
The field plots were located among 4 different Sentinel-2 tiles. We used iota2 to manage and pre-process Sentinel 1 and Sentinel 2 time series. Then we investigated several machine learning regression algorithms to relate the pixel’s spectro-temporal profile to these diversity indices. Among the several diversity indices tested, Simpson and Shannon indices were best predicted with a coefficient of determination around 0.4 using a Random Forest predictor and Sentinel-2 data. The use of Sentinel-1 data was not found to improve significantly the prediction accuracy. The table below shows the best results obtained (R-IR means that the features used were the red and near-infra red bands, S2 means all the spectral bands at 10m, S2-NDVI means that the NDVI profiles were added and S1-S2 means VV, VH and HH S1 polarization and S2 spectral bands were used together).
|
Data |
Model |
R2 |
Index |
|
R-IR |
Random Forest |
0.45 (+- 0.13) |
Simpson |
|
S2 |
Random Forest |
0.44 (+- 0.08) |
Simpson |
|
R-IR |
Random Forest |
0.43 (+- 0.13) |
Shannon |
|
S2-NDVI |
Random Forest |
0.43 (+- 0.17) |
Simpson |
|
S2-NDVI |
Random Forest |
0.41 (+- 0.17) |
Shannon |
|
S1-S2 |
Random Forest |
0.41 (+- 0.13) |
Simpson |
|
S2 |
Random Forest |
0.40 (+- 0.14) |
Shannon |
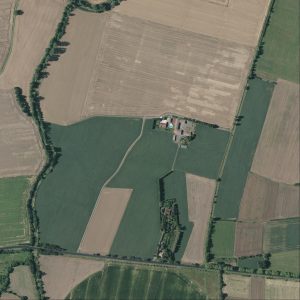
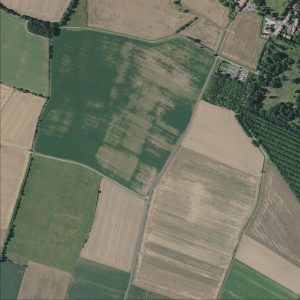
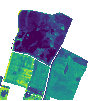
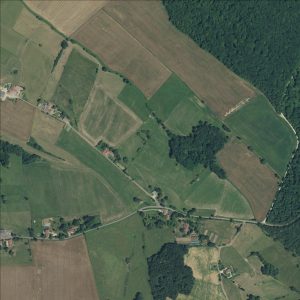
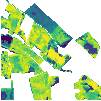
Thanks to iota2, we then predicted the Simpson index for all the grasslands of the region, at the pixel scale. It was the first time such predictions were performed at a resolution of 10m per pixel. Figures below show some predicted parcels (high resolution ortho image & Simpson index predicted).

The contribution of this work does not lie in selecting the best set of dates nor the best machine learning regression methods but in assessing the potential of Sentinel-1 and -2 dense times series as explanatory variables for the prediction of grasslands biodiversity indices. We believe that our results, using large scale data with various agricultural practices for different meteorological and topographic conditions, demonstrate the capacity of such data to monitor grasslands from an ecological viewpoint. In particular, intra-parcel variability was highlighted in this work and can be monitored over large areas. Yet, accuracy scores are still limited and methodological works need to be done to improve them.