Monitoring the snow cover in ski resorts using Sentinel-2
 =>
=> We are preparing the distribution of maps of the snow cover extent made from the Sentinel-2 data for Theia. If the method used to detect the snow is based on well-proven concepts, spatial and temporal resolution of the snow maps will however quite unprecedented. Until now, maps of the snow cover extent were usually produced from MODIS observations at 500 m resolution, which is adapted to hydro-climatic studies to rather regional scales. Landsat data were actually little exploited by snow scientists because of their low repeatability. The deployment of Sentinel-2 mission (global coverage at 20 m resolution every 5 days) opens new perspectives for monitoring snow cover.
Sentinel-2A is already operational but still lacks its twin Sentinel-2B to achieve a repeatability of 5 days. Fortunately the Take 5 experiment gives us food for thought until the launch of Sentinel-2B. One of the SPOT-5 Take 5 sites (tile « France-Ecrins ») just covers the famous ski resorts of L’Alpe d’Huez and Les Deux Alpes. Alpine ski enthusiasts will know that the Deux Alpes resort is equipped for summer skiing unlike that of the Alpe d’Huez. So I ran our « Let-it-snow » processor on this series of SPOT-5 images to extract the snow cover area over a region that covers both ski resorts, between April 11 and September 8, 2015. Then I interpolated part of the images covered by clouds by applying the following rules:
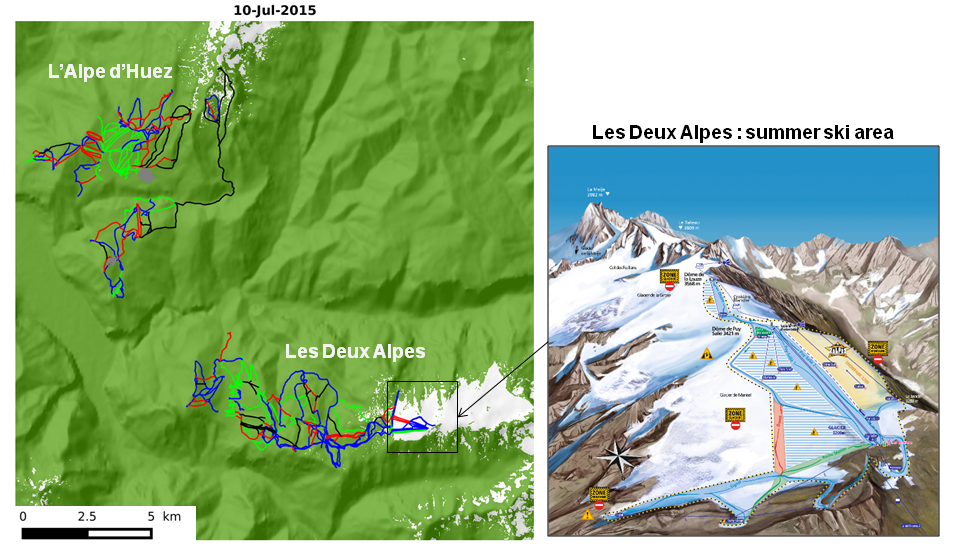
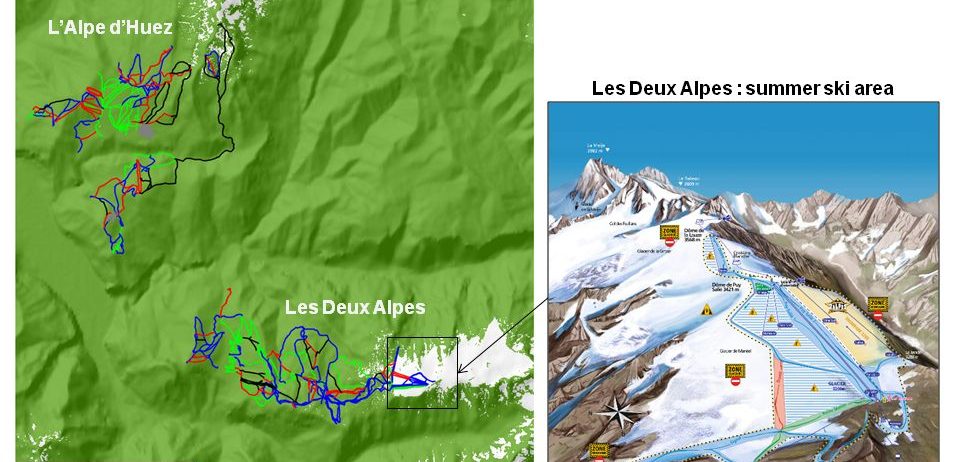
This enables to fill some cloudy pixels but not all. We are working on a more sophisticated method to fill all the gaps caused by clouds. Finally, I draped the snow masks on a hill-shaded image of the relief and superimposed the maps of the pistes of both resorts.

We can verify that the summer ski area of Les Deux Alpes is actually snow-covered in summer! The lower edge of snow cover perfectly follows the « Signal » blue piste in the lower limit of the domain. The satellite does not tell us, however, if it is natural snow …