Kyrgyzstan viral avalanche. First views of the glacier scar using Pléiades images
Last week, Simon Gascoin and I spent quite some time working on the Marmolada event. Just a week-end to rest and Twitter reminded us Monday morning that this summer 2022 was special for glaciers. Not only are they out of balance with the climate and will probably suffer one of their most negative mass balance years, at least in the Alps, but they also collapse.
A viral video of an avalanche in Kyrgyzstan caught our attention.
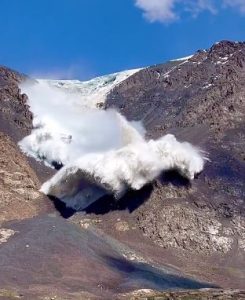
The amount of ice and the time of the year (mid-summer) suggested that it could not be a normal snow avalanche but that something happened to the glacier. Given how remote this place is, satellite data are needed to describe the event and to better understand why glaciers are collapsing and if these collapses are getting more frequent.
Thanks to support from CNES, we could activate a tool called CIEST² to obtain a stereo pair of the event. “Sieste” means nap in French… The tasking of the Pléiades satellites was defined yesterday afternoon (11 July) and this morning at 07:45 CESBIO/LEGOS-time (i.e. 5h45 UTC), the first stereo pair was acquired by Pléiades-1A. At 10:00, the image reached our desks. One of the two images is cloudy on the area of interest but the other reveals a clear scar that marks the upper limit of the detachment. The tongue of the glacier indeed collapsed entirely over a width of almost 300 m. Because of the clouds, we thought it would be hard to derive a meaningful digital elevation model (DEM).
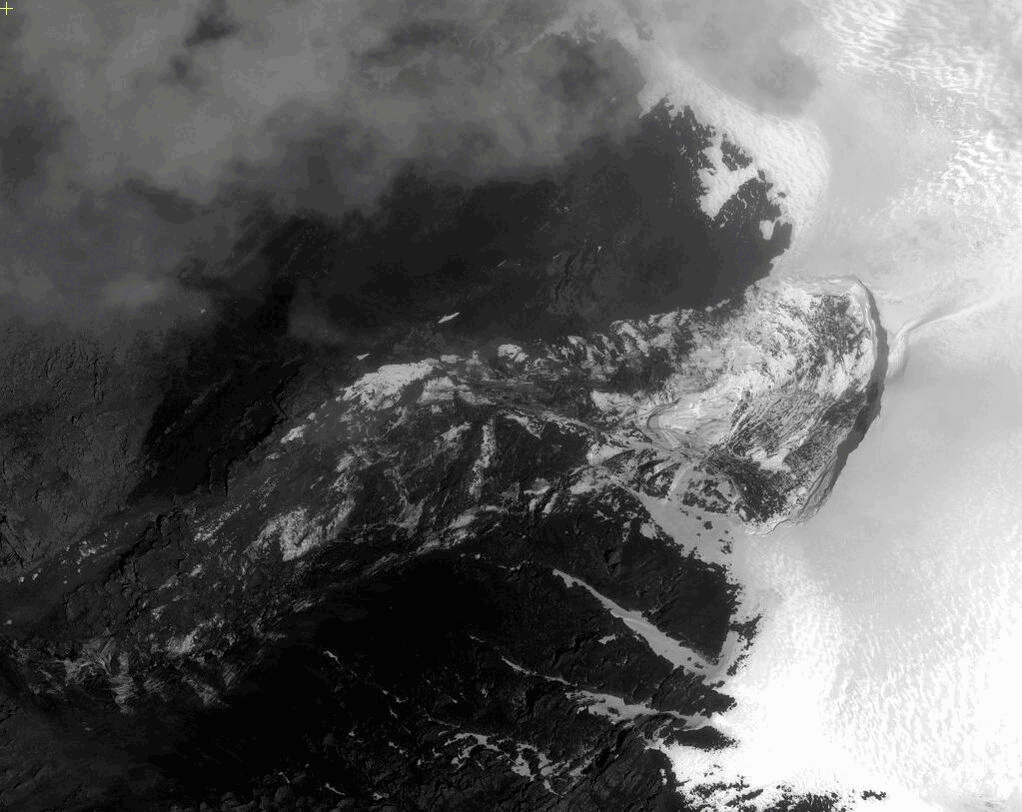
But the software (ASP or MicMac/DSM-OPT) are able to match some features “behind the clouds” that our eyes do not see that well. Of course, the resulting DEM is not complete but still provides a first quantitative description of the event.
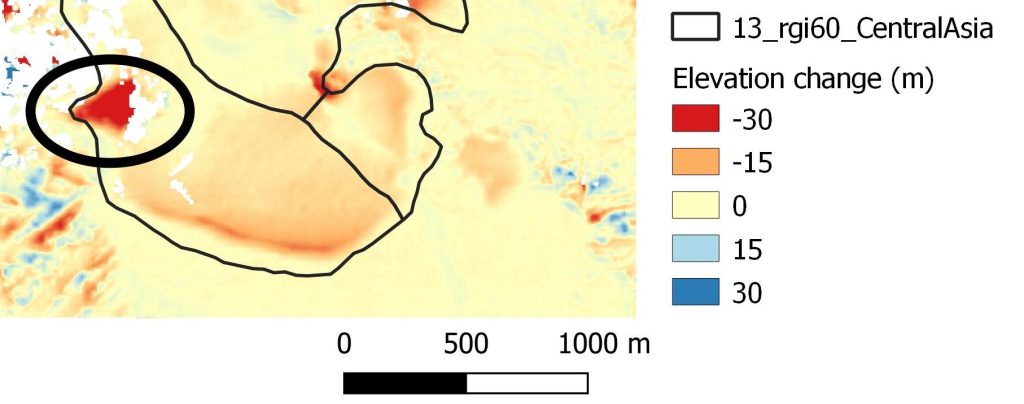
By 13:00 (only 5 hours after the image acquisition), Lucky Luke Simon had already computed a map of the elevation differences using the Copernicus 30 m DEM as reference. The latter is derived from Tandem-X images acquired between 2011 and 2015 so the elevation change map also includes 10-year of glacier changes. However, the changes appear rather moderate at this specific site (as also confirmed by the 20-year changes maps from Hugonnet et al., 2021).


Hence we can calculate a first (rough) estimate of the volume involved. Over a collapsed area of about 0.05 km², the mean elevation drop is 30 m (max=50 m), so the volume loss is roughly 1. 5 millions m³. For context, this is >20 times larger than the Marmolada event, but 40 times less than the Aru 2016 twin avalanches.
We hope to refine this description in the coming days if a cloud free Pléiades stereo-pair is acquired and if we can access an archived SPOT7 stereo pair from September 2021 to have a higher resolution and more recent pre-event DEM.