
Estimation of Marmolada glacier collapse volume using Pléiades imagery
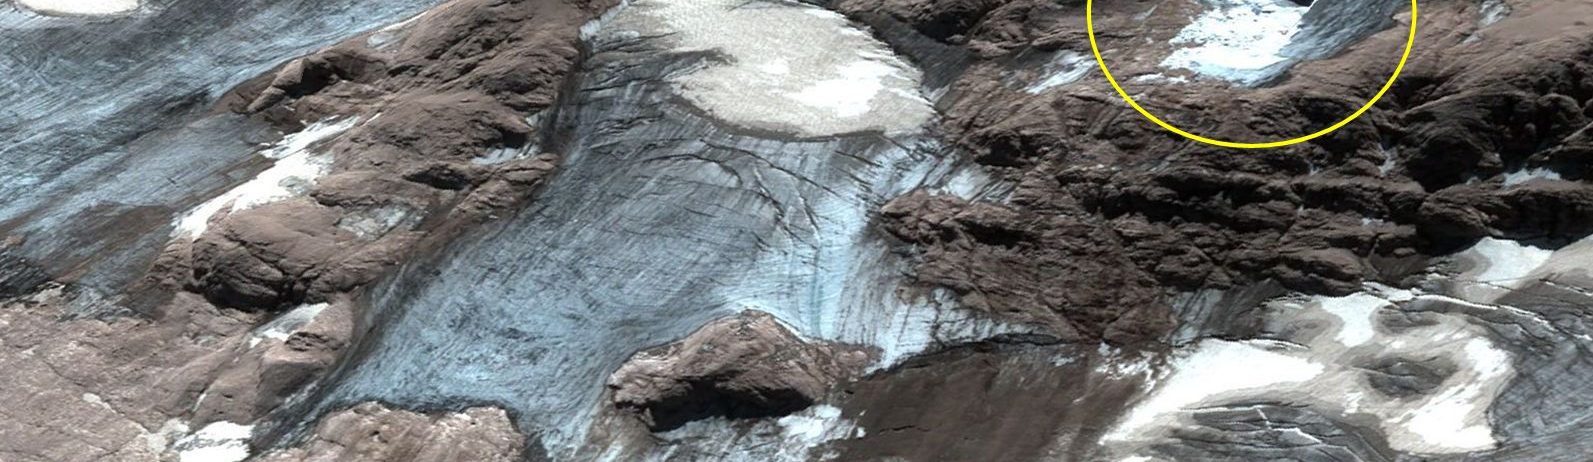
The deadly Marmolada glacier collapse happened on 3 July 2022. On 6 July 2022, Pléiades 1B (CNES, Airbus DS) acquired a clear-sky stereo pair of the area. From these images we could estimate a detached volume of ice of 65’000 ± 10’000 cubic meters.
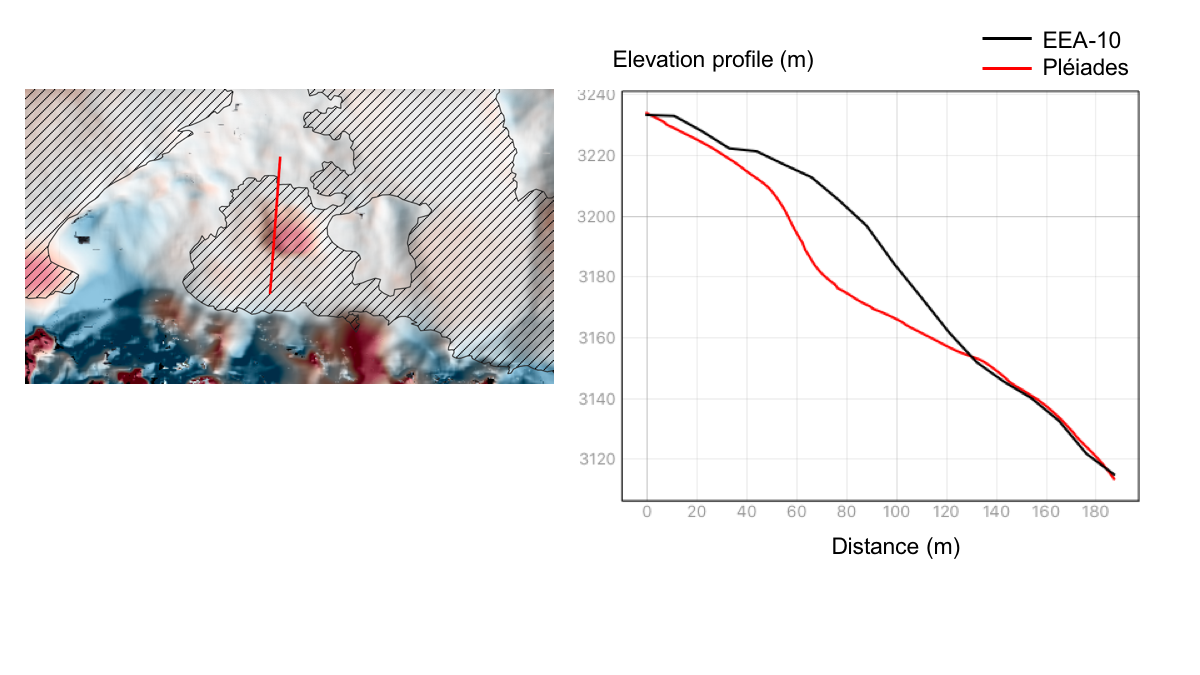
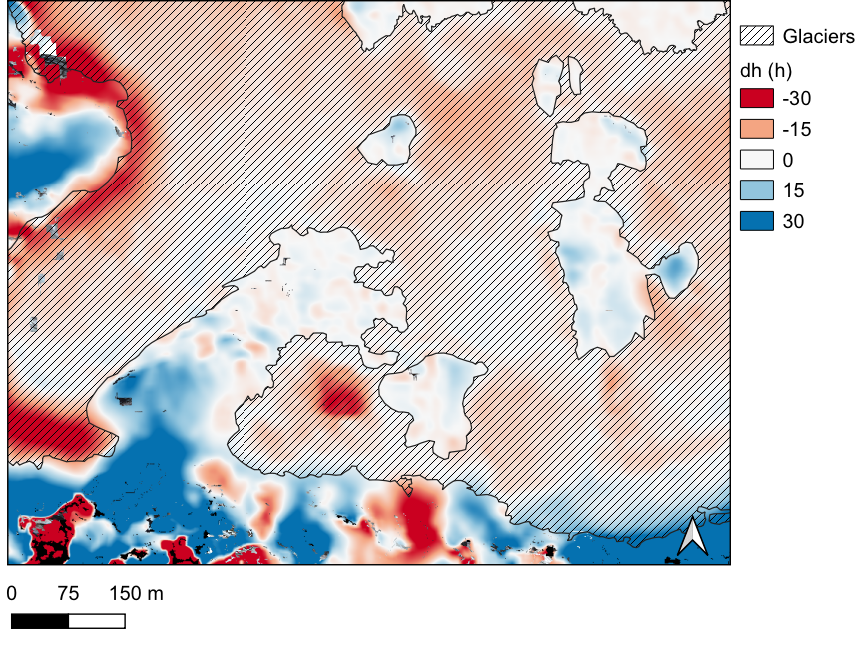
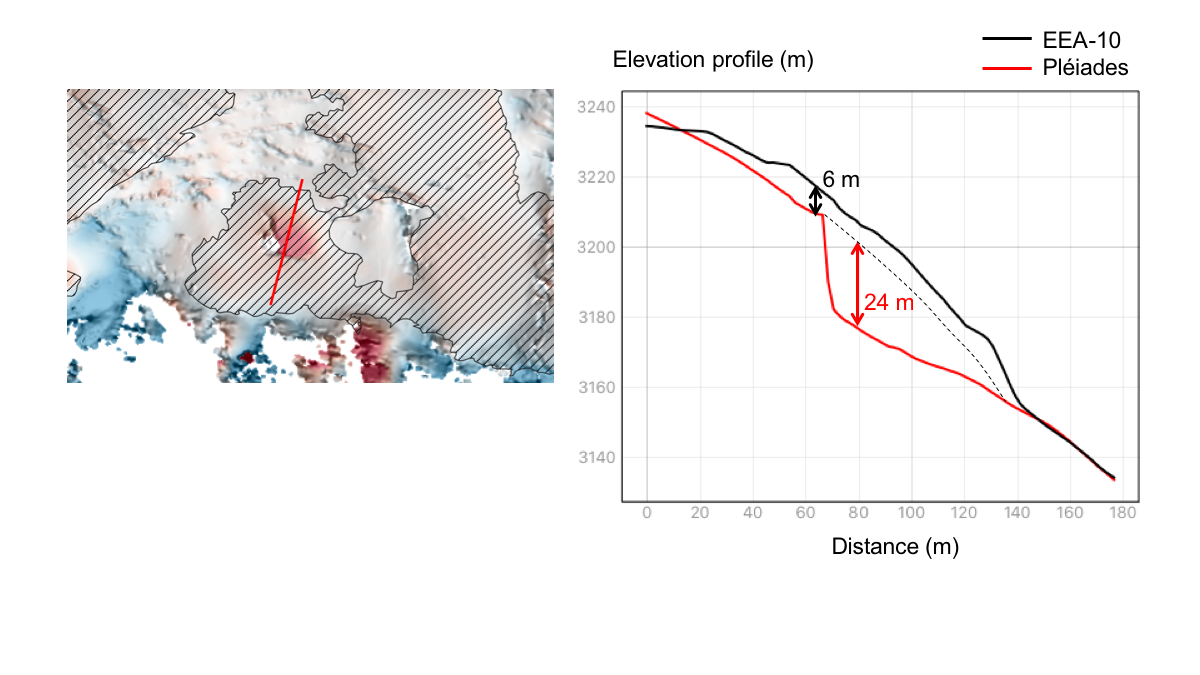
First, we generated a digital elevation model (DEM) from Pléiades stereo images*. This was done by Etienne using the Ames Stereo Pipeline and Simon using the online tool DSM-OPT provided by Form@terre (with MicMac photogrammetry software under the hood). Then, we aligned the DEM on the EEA-10 Copernicus DEM. Since the EEA-10 DEM was acquired between 2011 and 2015, the elevation difference also includes the glacier thinning that occurred before the collapse. We estimated this elevation change by averaging the elevation changes around the detached area where the ice was still present. The remaining elevation change (up to 20-25 m) is due to the collapse. By integration over the detached area, we obtained a detached volume of ice of 61’000 m3 (Etienne) and 68’000 m3 (Simon), hence our final estimate of 65’000 ± 10’000 of cubic meters. This is the volume of 26 Olympic swimming pools. Although deadly, this detached volume is relatively modest compared to earlier detachments elsewhere in the globe, that reached volumes up to 1000 times larger (Kääb et al. 2021).
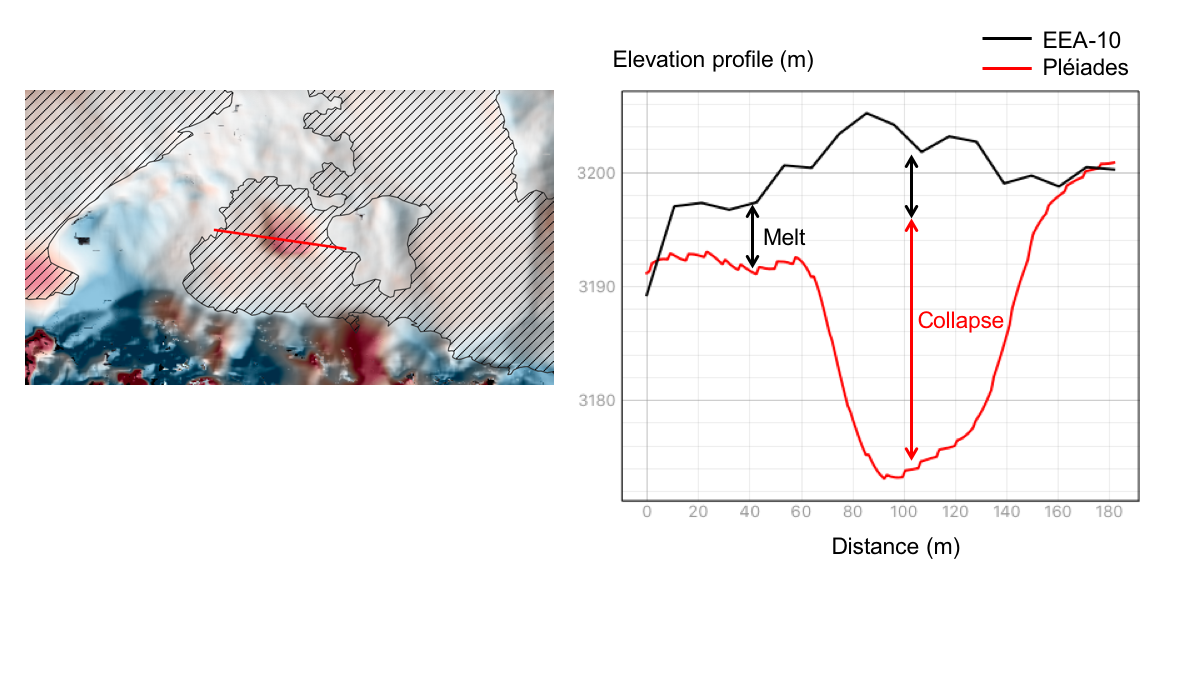
In addition, we can estimate that the rupture is about 80 m wide and 20-25 m high.
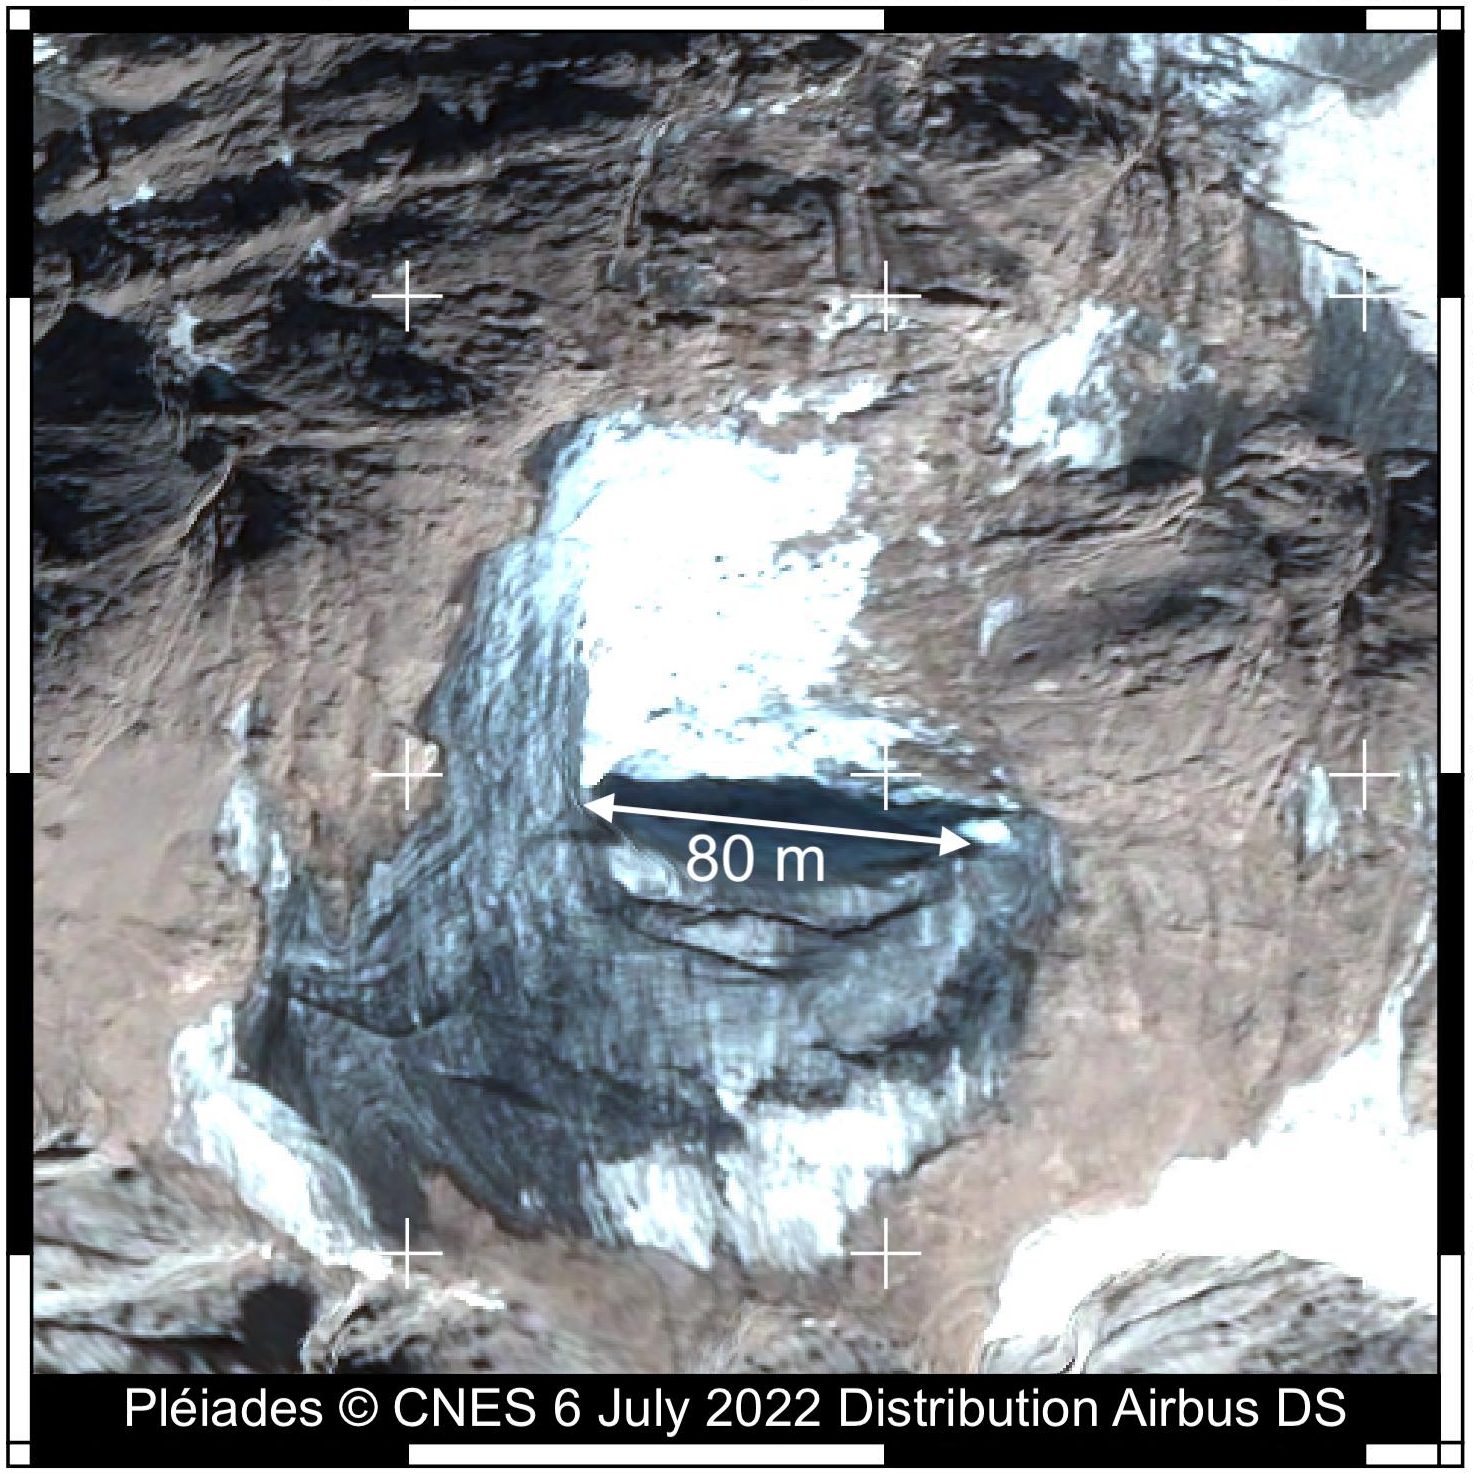
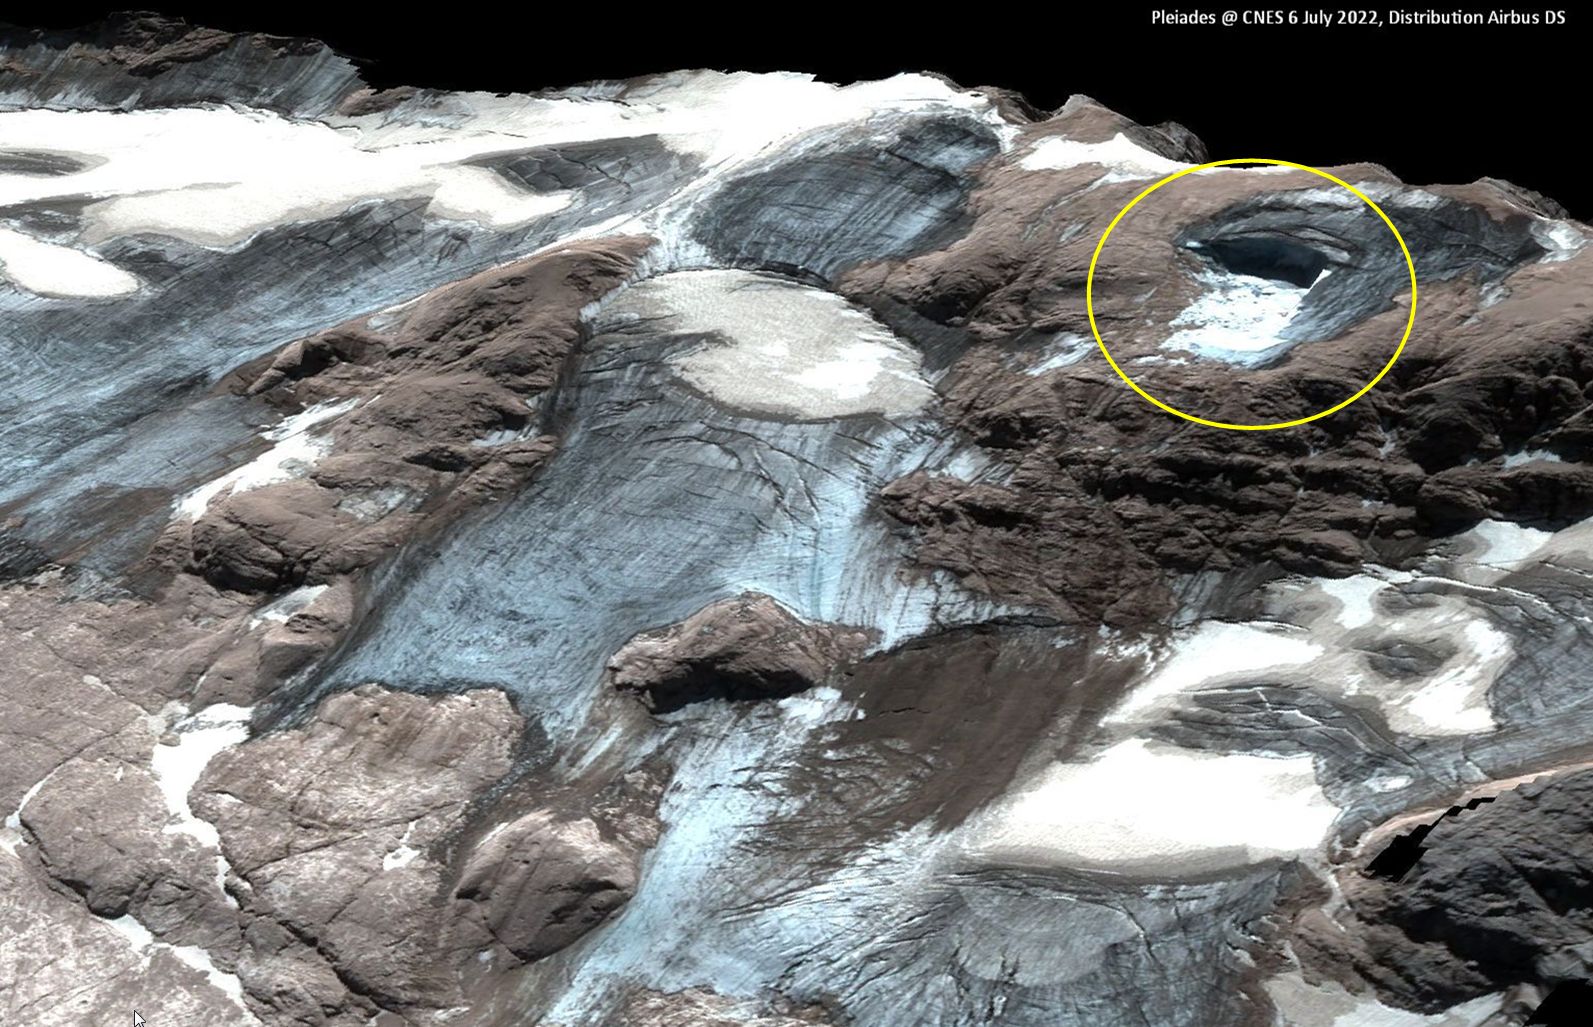
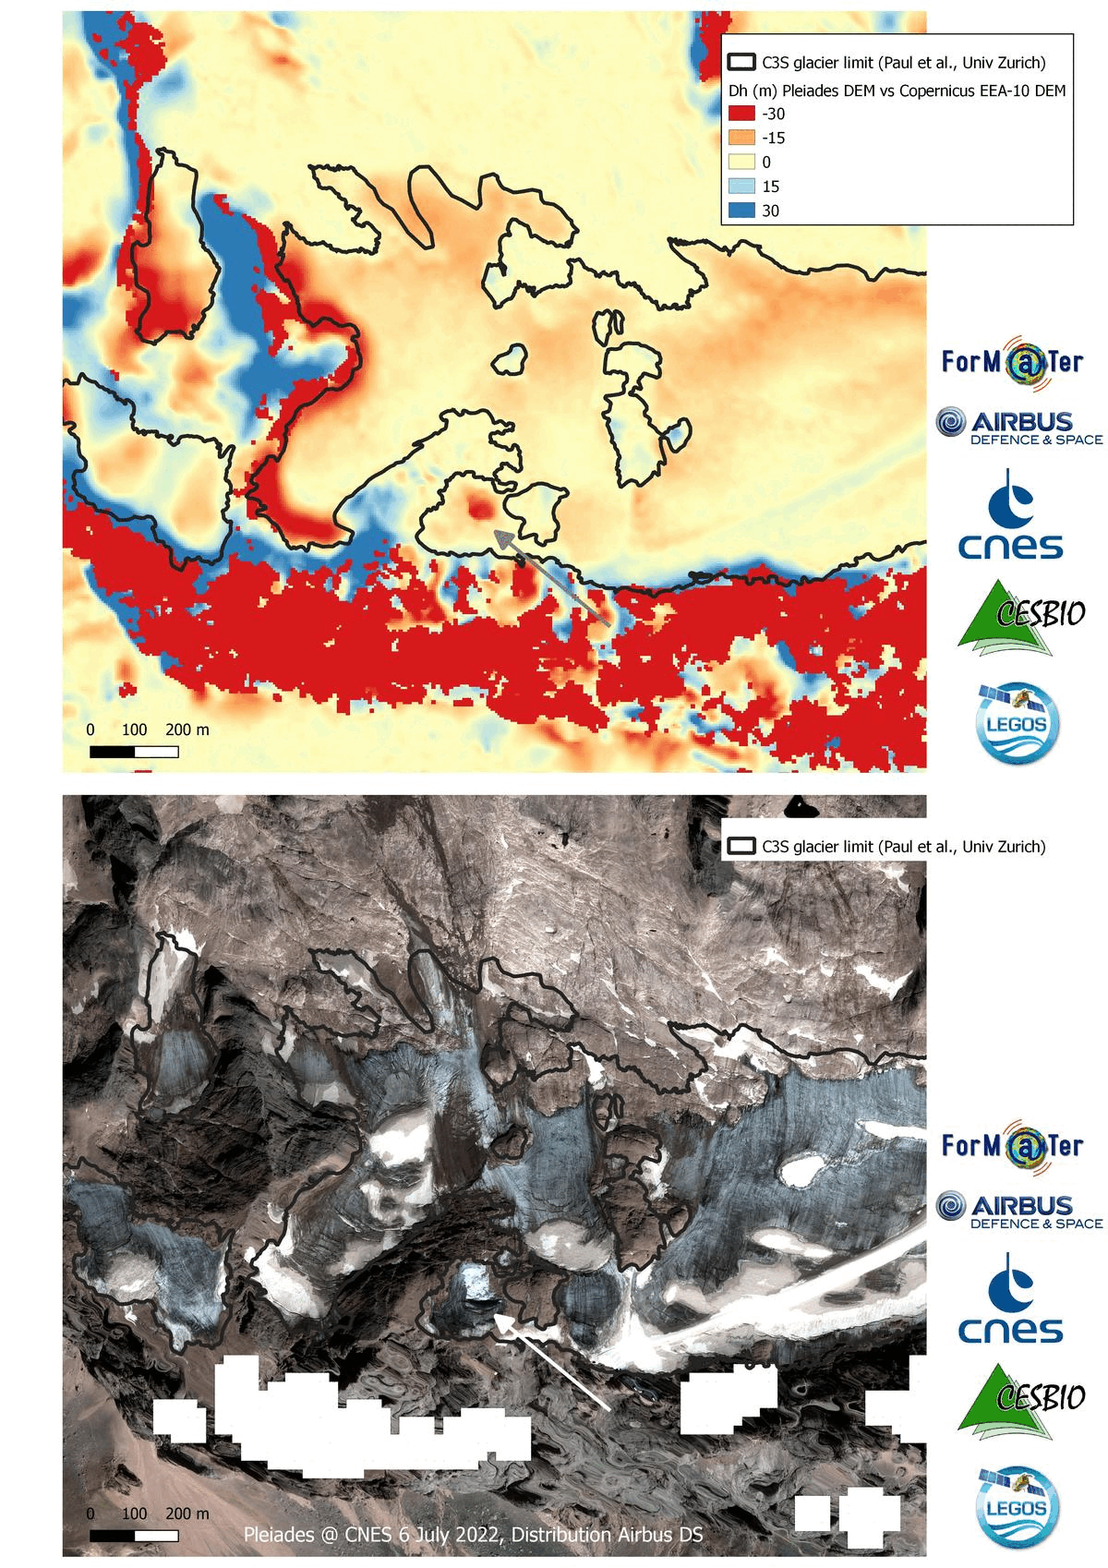
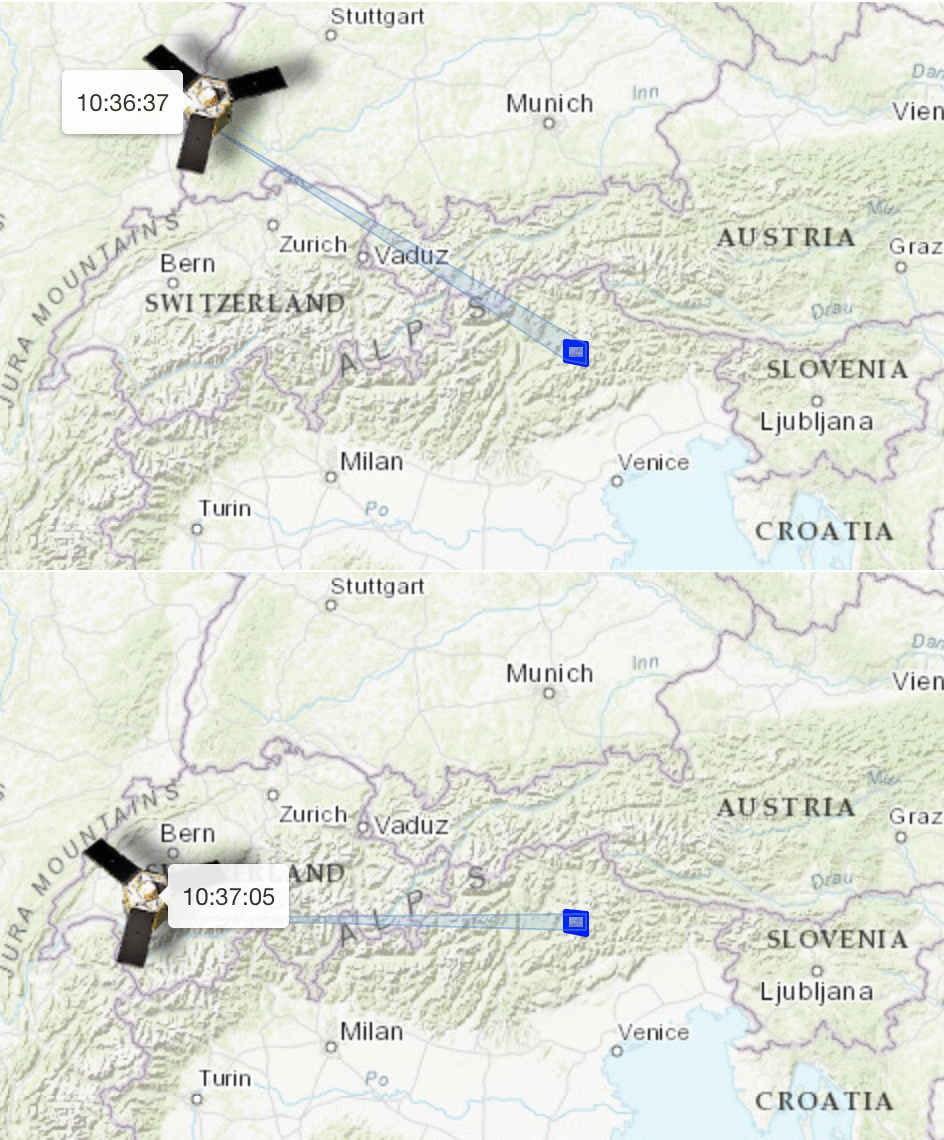
The images were acquired in emergency mode thanks to the Cellule d’Intervention et d’Expertise Scientifique et Technique nouvelle génération (CIEST²) sponsored by CNES. Pléaides images are distributed by Airbus DS.
*Update 8 July: we have a computed a sharper DEM which better captures the ice cliff. From this DEM we can better estimate the height of the detachment near the rupture zone (24 m ± 2 m). Here we removed 6 m to account for ice melt between both DEMs before the collapse based on the elevation difference on glacier just above the collapse.
Authors: Etienne Berthier, Simon Gascoin


