How to use on demand InSAR to analyse the Joshimath landslide
International news media reported that the Joshimath city in north India (Uttarakhand) was « sinking » due to a slow landslide. In January, many houses had developed major cracks on the walls and 145 families were temporarily moved. The Indian space agency published a map of the ground deformation obtained by SAR interferometry using Sentinel-1 data. Although this method may seem complex, it is actually easy to do its own analysis based on free tools without downloading huge amount of satellite data. I give below a few hints but I can provide more details in the comments.
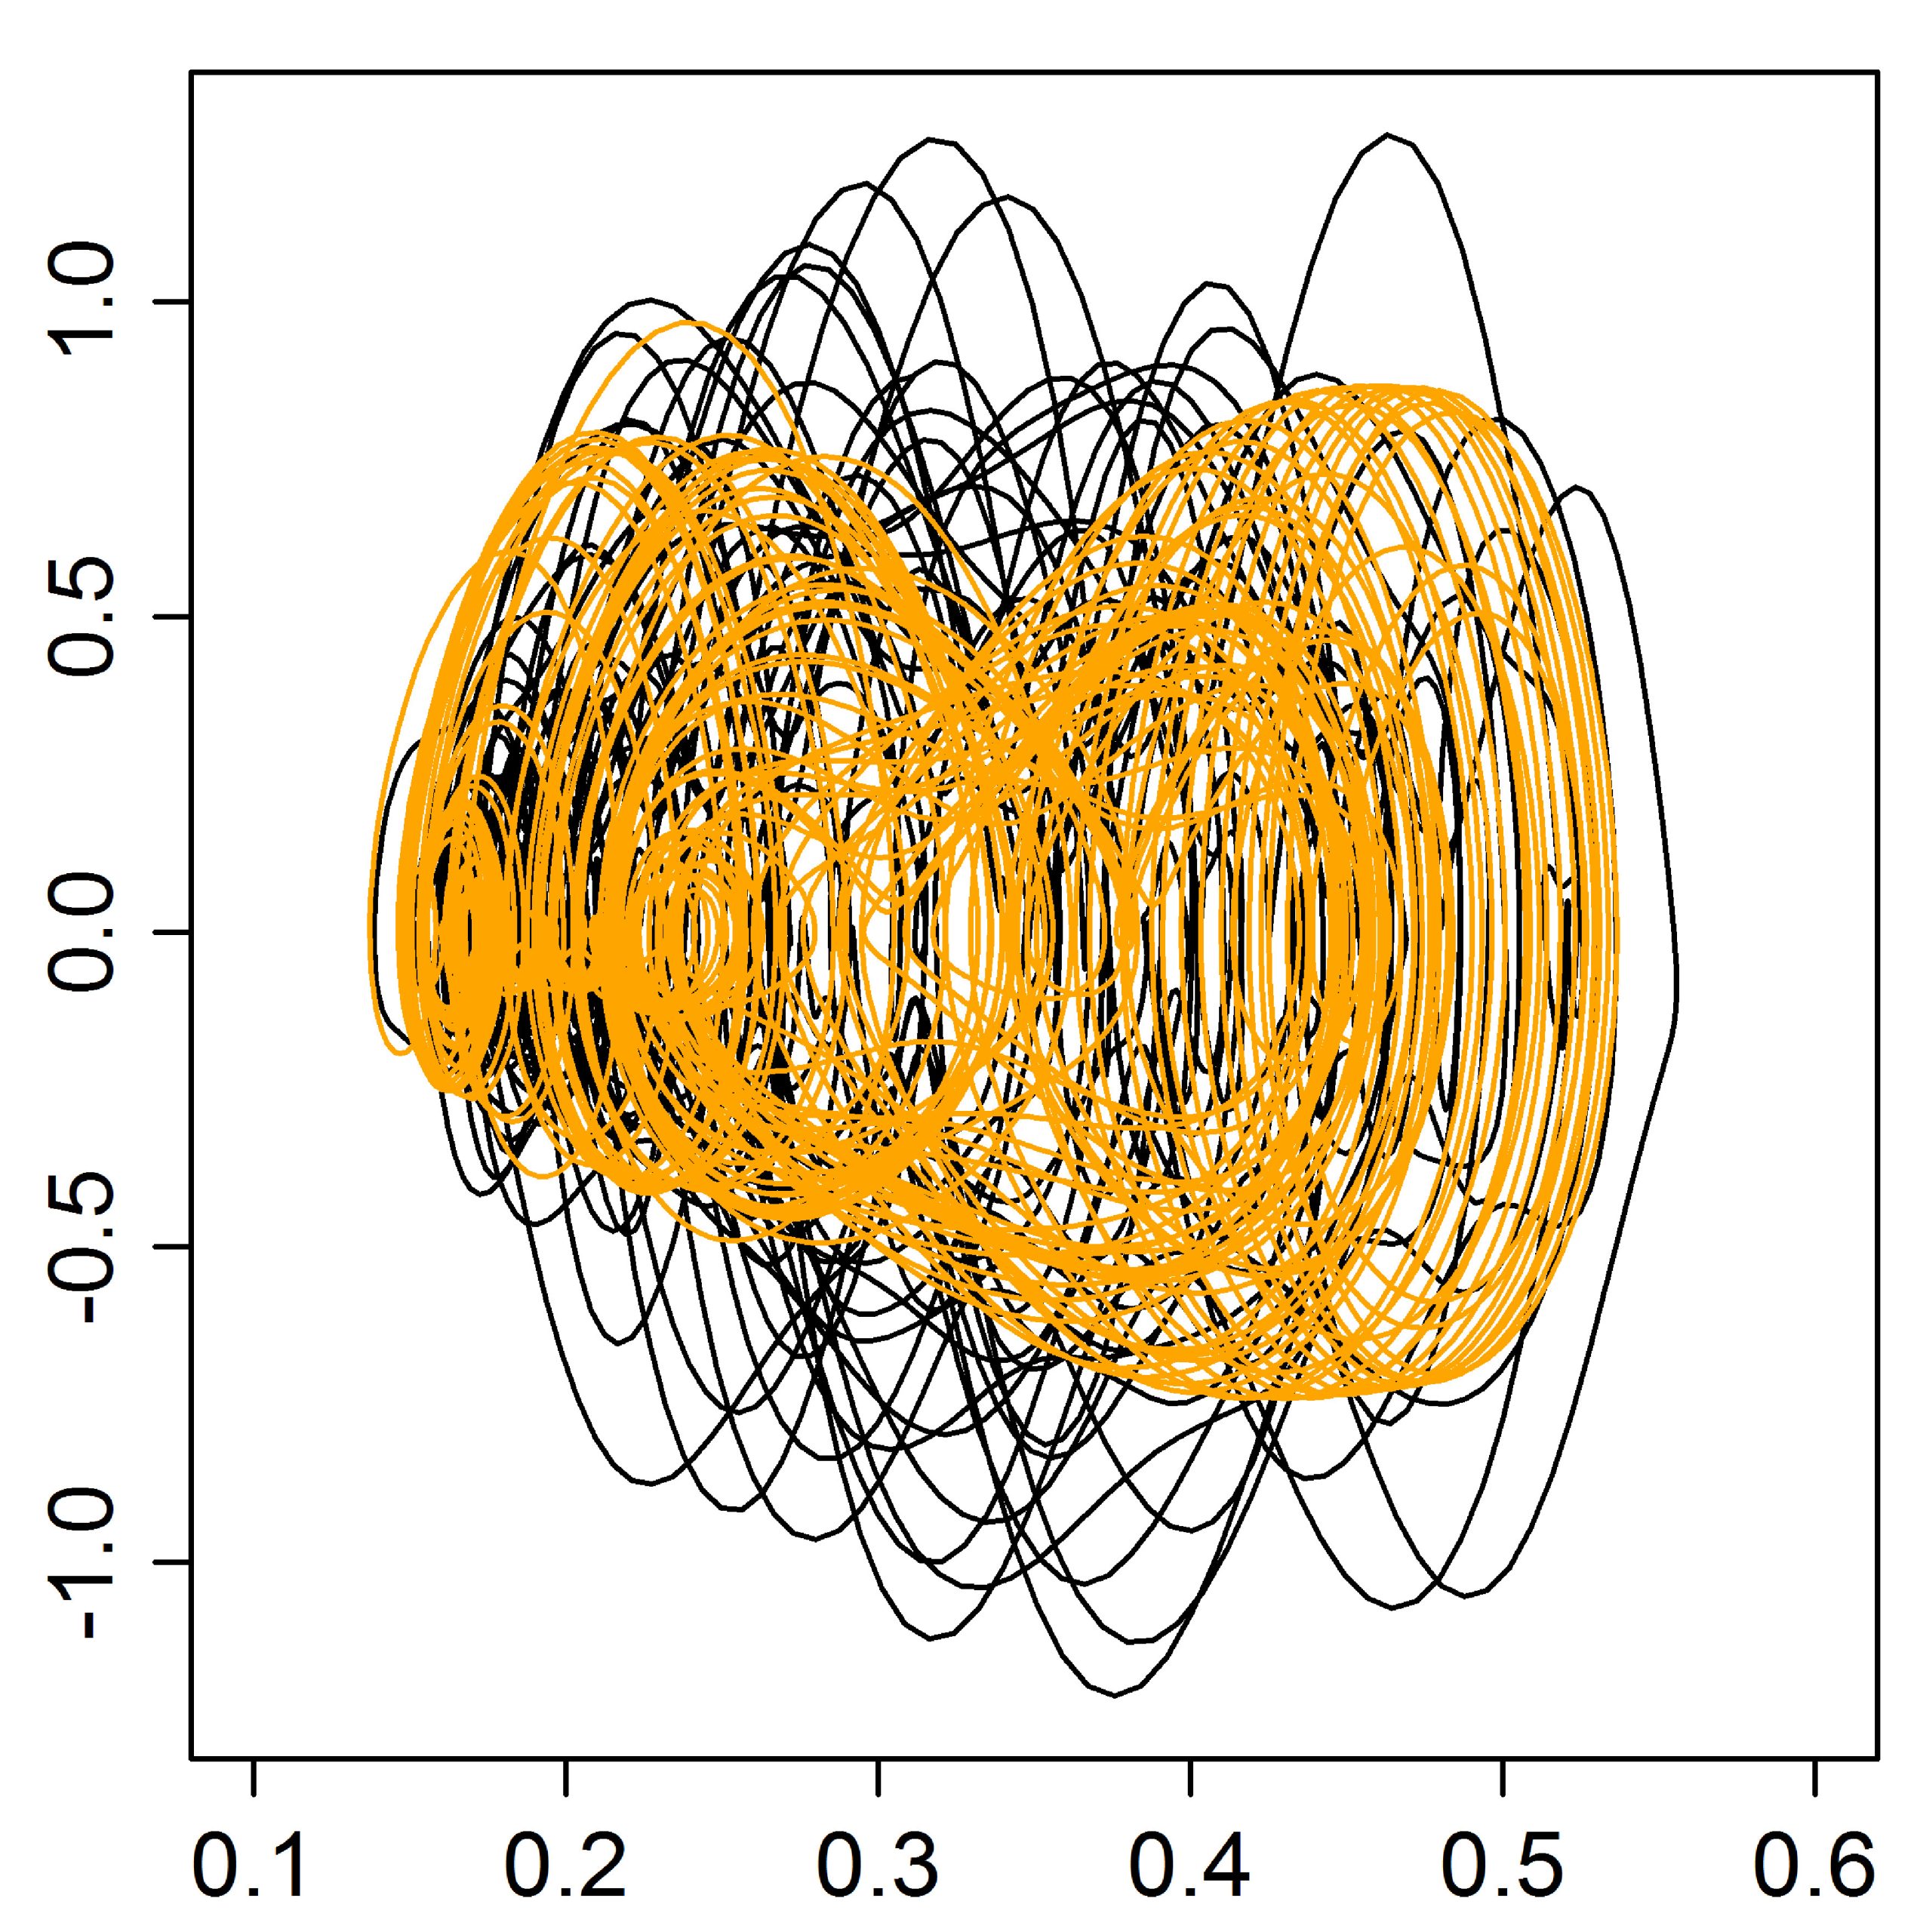
First, the InSAR processing can be done remotely from Alaska Satellite Facility’s web portal (Vertex). Their baseline tool identifies Sentinel-1 pairs that are appropriate for InSAR processing. The computation is done on ASF servers using the GAMMA software. I looked for pairs associated with the product acquired on 2022-12-27 over Joshimath. This scene can be matched with the scene of 2023-01-08 (12 days later). The highest level product is the vertical displacement map below:
ASF/Vertex also provides a search engine to find all secondary scenes that match the coverage area of the reference (small baseline subset, SBAS). Using this tool I queried all pairs of Sentinel-1 scenes that are 12 days apart and submitted the InSAR processing of the 110 identified pairs. The « mintpy » option activates the generation of all necessary files to post-process the results using MintPy.
The MintPy software should be installed locally in a dedicated conda environment. It allows the definition of a reference fixed pixel which is used to infer the displacement values in the region of interest. Before running MintPy main script (smallbaselineApp.py), it is recommended to clip the files obtained from ASF for each InSAR pair (unwrapped phase, correlation, DEM, view angles, water mask) to the region of interest. This can be done efficiently using gdalwarp -crop_to_cutline without unzipping the downloaded files through the vsizip file handler.
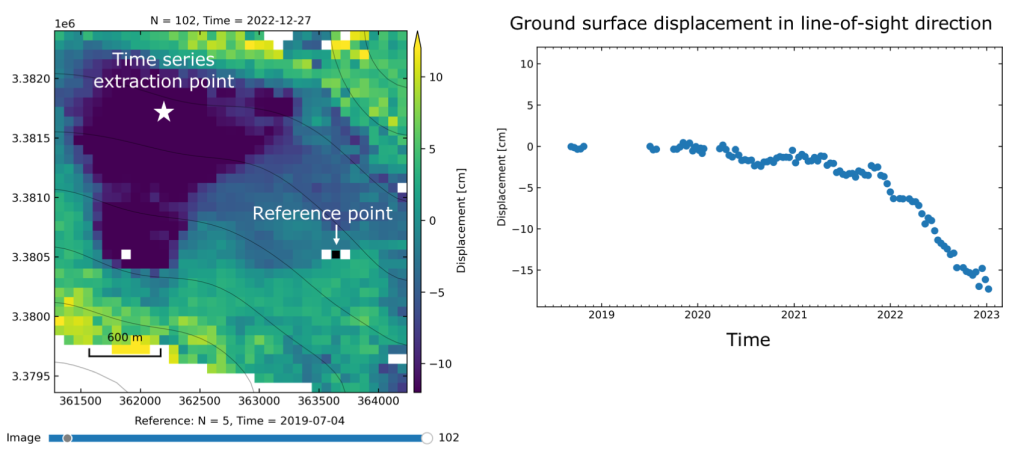
The MintPy package provides the tsview.py tool to easily obtain displacement time series at specific locations:
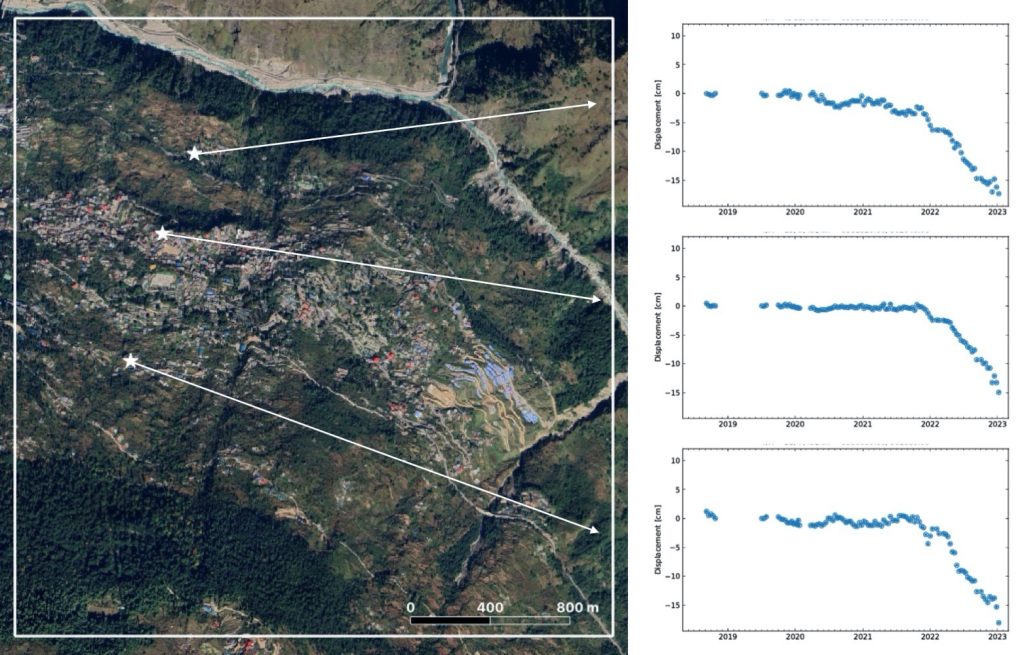
Ideally, these results should be evaluated using in situ GPS data. The reference point may be better defined using a good knowledge of the study area. But the above results are in agreement with reports that the first cracks appeared in October 2021. Also it is possible to note an acceleration in 2023 in the area of the city where most of the damages were observed.
Joshimath is located in the Chamoli district, in the same valley that was flooded by a massive rock and ice avalanche in 2021 and that we studied using Pléiades optical stereo images.
Top picture: Joshimath, view from Narsingh temple, Uttarakhand, India by ArmouredCyborg, CC BY-SA 4.0, via Wikimedia Commons