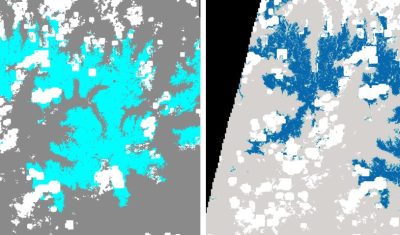
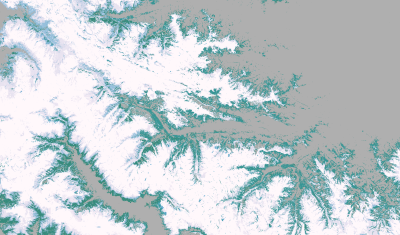
snow-ice
How to find the closest snow to you?
If you live in Pamiers near Toulouse, France, where is the snow-covered place that is the fastest accessible by car or by bike? There is a beautiful snow map of the Pyrenees mountains near Pamiers from a Sentinel-2 image that was acquired yesterday (at the time of writing) [link to the data]. In QGIS with […]
Theia vous aide à trouver la neige la plus proche de chez vous
Si vous habitez à Pamiers, où se trouve la neige la plus rapidement accessible en voiture ? Theia nous fournit une belle carte de l’enneigement du 19 novembre 2019 dans les Pyrénées ariégeoises (lien vers les données). Dans QGIS avec l’API OpenRouteService on peut calculer les isochrones pour un trajet en voiture depuis Pamiers : […]
The flow of Pine Island Glacier in Antarctica as seen by Sentinel-1
The clip below shows the evolution of Pine Island glacier ice tongue in West Antarctica, from June 2017 to October 2019. I made it with 111 quicklooks of Sentinel-1 radar images processed by the Alaska Satellite Facility and available via the vertex data portal. All images were acquired in interferometric wide swath mode (polarization HH, […]
Khumbu icefall in 4D
This video shows all available Venµs images since launch over the Khumbu icefall near Mt Everest (109 images). The images are RGB composites of Level 1C bands 7,4,3 (5 m resolution) that were draped onto the HMA 8m DEM. How to do that? First download the Venµs images using theia_download.py, extract the region of […]
Upgrade of let-it-snow to compute the fractional snow cover
In preparation for the next Pan European high resolution snow and ice monitoring service, I have upgraded the let-it-snow (LIS) processor to enable the computation of the fractional snow cover (FSC) within the pixel. So far LIS was only used to compute a « binary snow mask » (in fact ternary: snow, no-snow, cloud). However, the EEA […]
Synthèses mensuelles de la durée d’enneigement dans les Alpes françaises
Pour le Conservatoire botanique national alpin j’ai généré les cartes de durée d’enneigement par mois (avril, mai, juin et juillet) pour 2016, 2017 et 2018 à partir de toutes les images Sentinel-2 et Landsat-8 disponibles chez Theia sur les Alpes (tuiles 31TGM 32TLS 31TGL 32TLR 31TGK 32TLQ). Normalement la méthode est conçue pour faire des […]
MAJA and LIS selected for the next Pan European high resolution snow and ice monitoring service
The European Environment Agency (EEA) has selected a consortium led by Magellium to implement the next Pan European high resolution snow and ice monitoring of the Copernicus Land Monitoring Service. This future service aims to monitor three variables at 20 m resolution over the tiles displayed above: All products should be generated from atmospherically corrected […]
Detecting geolocation errors in glacier outlines with Sentinel-2 snow cover duration maps
Two years ago I posted an animation of the snow cover area evolution near Zermatt, Switzerland from Sentinel-2 L2A data processed by LIS. From this time series of snow maps I generated a snow cover duration map and then I added the glacier outlines from the Randolph Glacier Inventory 5.0. I was satisfied by the […]
