A new operational method for monitoring oak dieback in the Centre-Val de Loire region
 =>
=> 
The results presented here are based on work published in the journal paper: F. Mouret, D. Morin, H. Martin, M. Planells and C. Vincent-Barbaroux, « Toward an Operational Monitoring of Oak Dieback With Multispectral Satellite Time Series: A Case Study in Centre-Val De Loire Region of France, » in IEEE Journal of Selected Topics in Applied Earth Observations and Remote Sensing, doi: https://doi.org/10.1109/jstars.2023.3332420
Introduction
Forest dieback is characterized by a reduction in tree vitality (defoliation, loss of branches and twigs), which may lead to death. It is caused by a combination of factors (soil, climate, pests, etc.) that can occur in sequence and/or in combination, leading to a loss of health in entire stands.
Climate change, an aggravating factor
Climate change has a direct impact on forests. The main factors are rising temperatures, extreme weather events and changes in rainfall patterns. Trees become more fragile and therefore more susceptible to pests and parasites, which are themselves favored by rising temperatures.

Case study: Oak dieback in the Centre-Val de Loire region
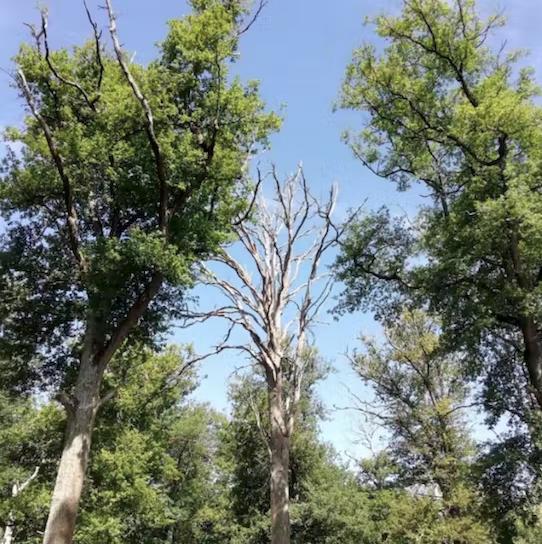
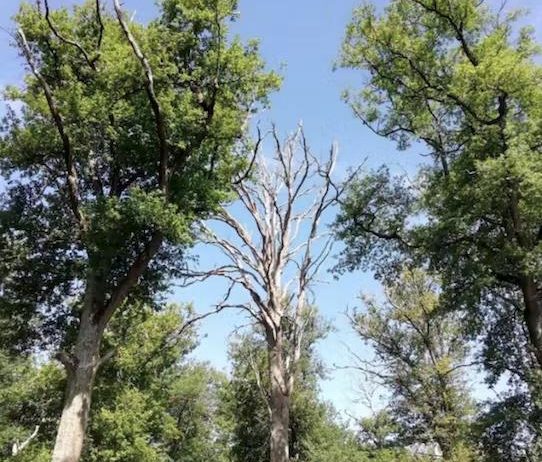
Sessile and pedunculate oaks, emblematic species of French forests and particularly present in the Centre-Val de Loire region, are affected by a massive increase in dieback. This increase follows the successive droughts of recent years (in particular 2018/2019/2020) and will continue in the coming decades. Unlike dieback in other species (e.g. bark beetle attacks on spruce), oak dieback is a slow and diffuse process that is particularly difficult to monitor.
Implementation of an operational monitoring system based on the iota2 processing chain
In this context, timely mapping of forest health is needed to best tailor the responses of the forest sector. Within the RECONFORT project of ARD SYCOMORE, a research program financed by the Centre-Val de Loire region, an operational monitoring system for oak decline has been developed by the University of Orléans and CESBIO. This monitoring system uses Sentinel-2 satellite imagery, which offers obvious advantages for such an application: high temporal revisit and spatial resolution suitable for precise detection. The processing chain is based on iota2, developed at CESBIO for large-scale mapping with satellite image time series. The use of iota2 means that the production chain is easily transferable and usable by different users (see, for example, our package for the production of dieback maps). In the context of our study, the iota2 chain was adapted to our needs. In particular, the model learning step is performed outside the chain, so that learning examples from several different years can be used (see Methods section).
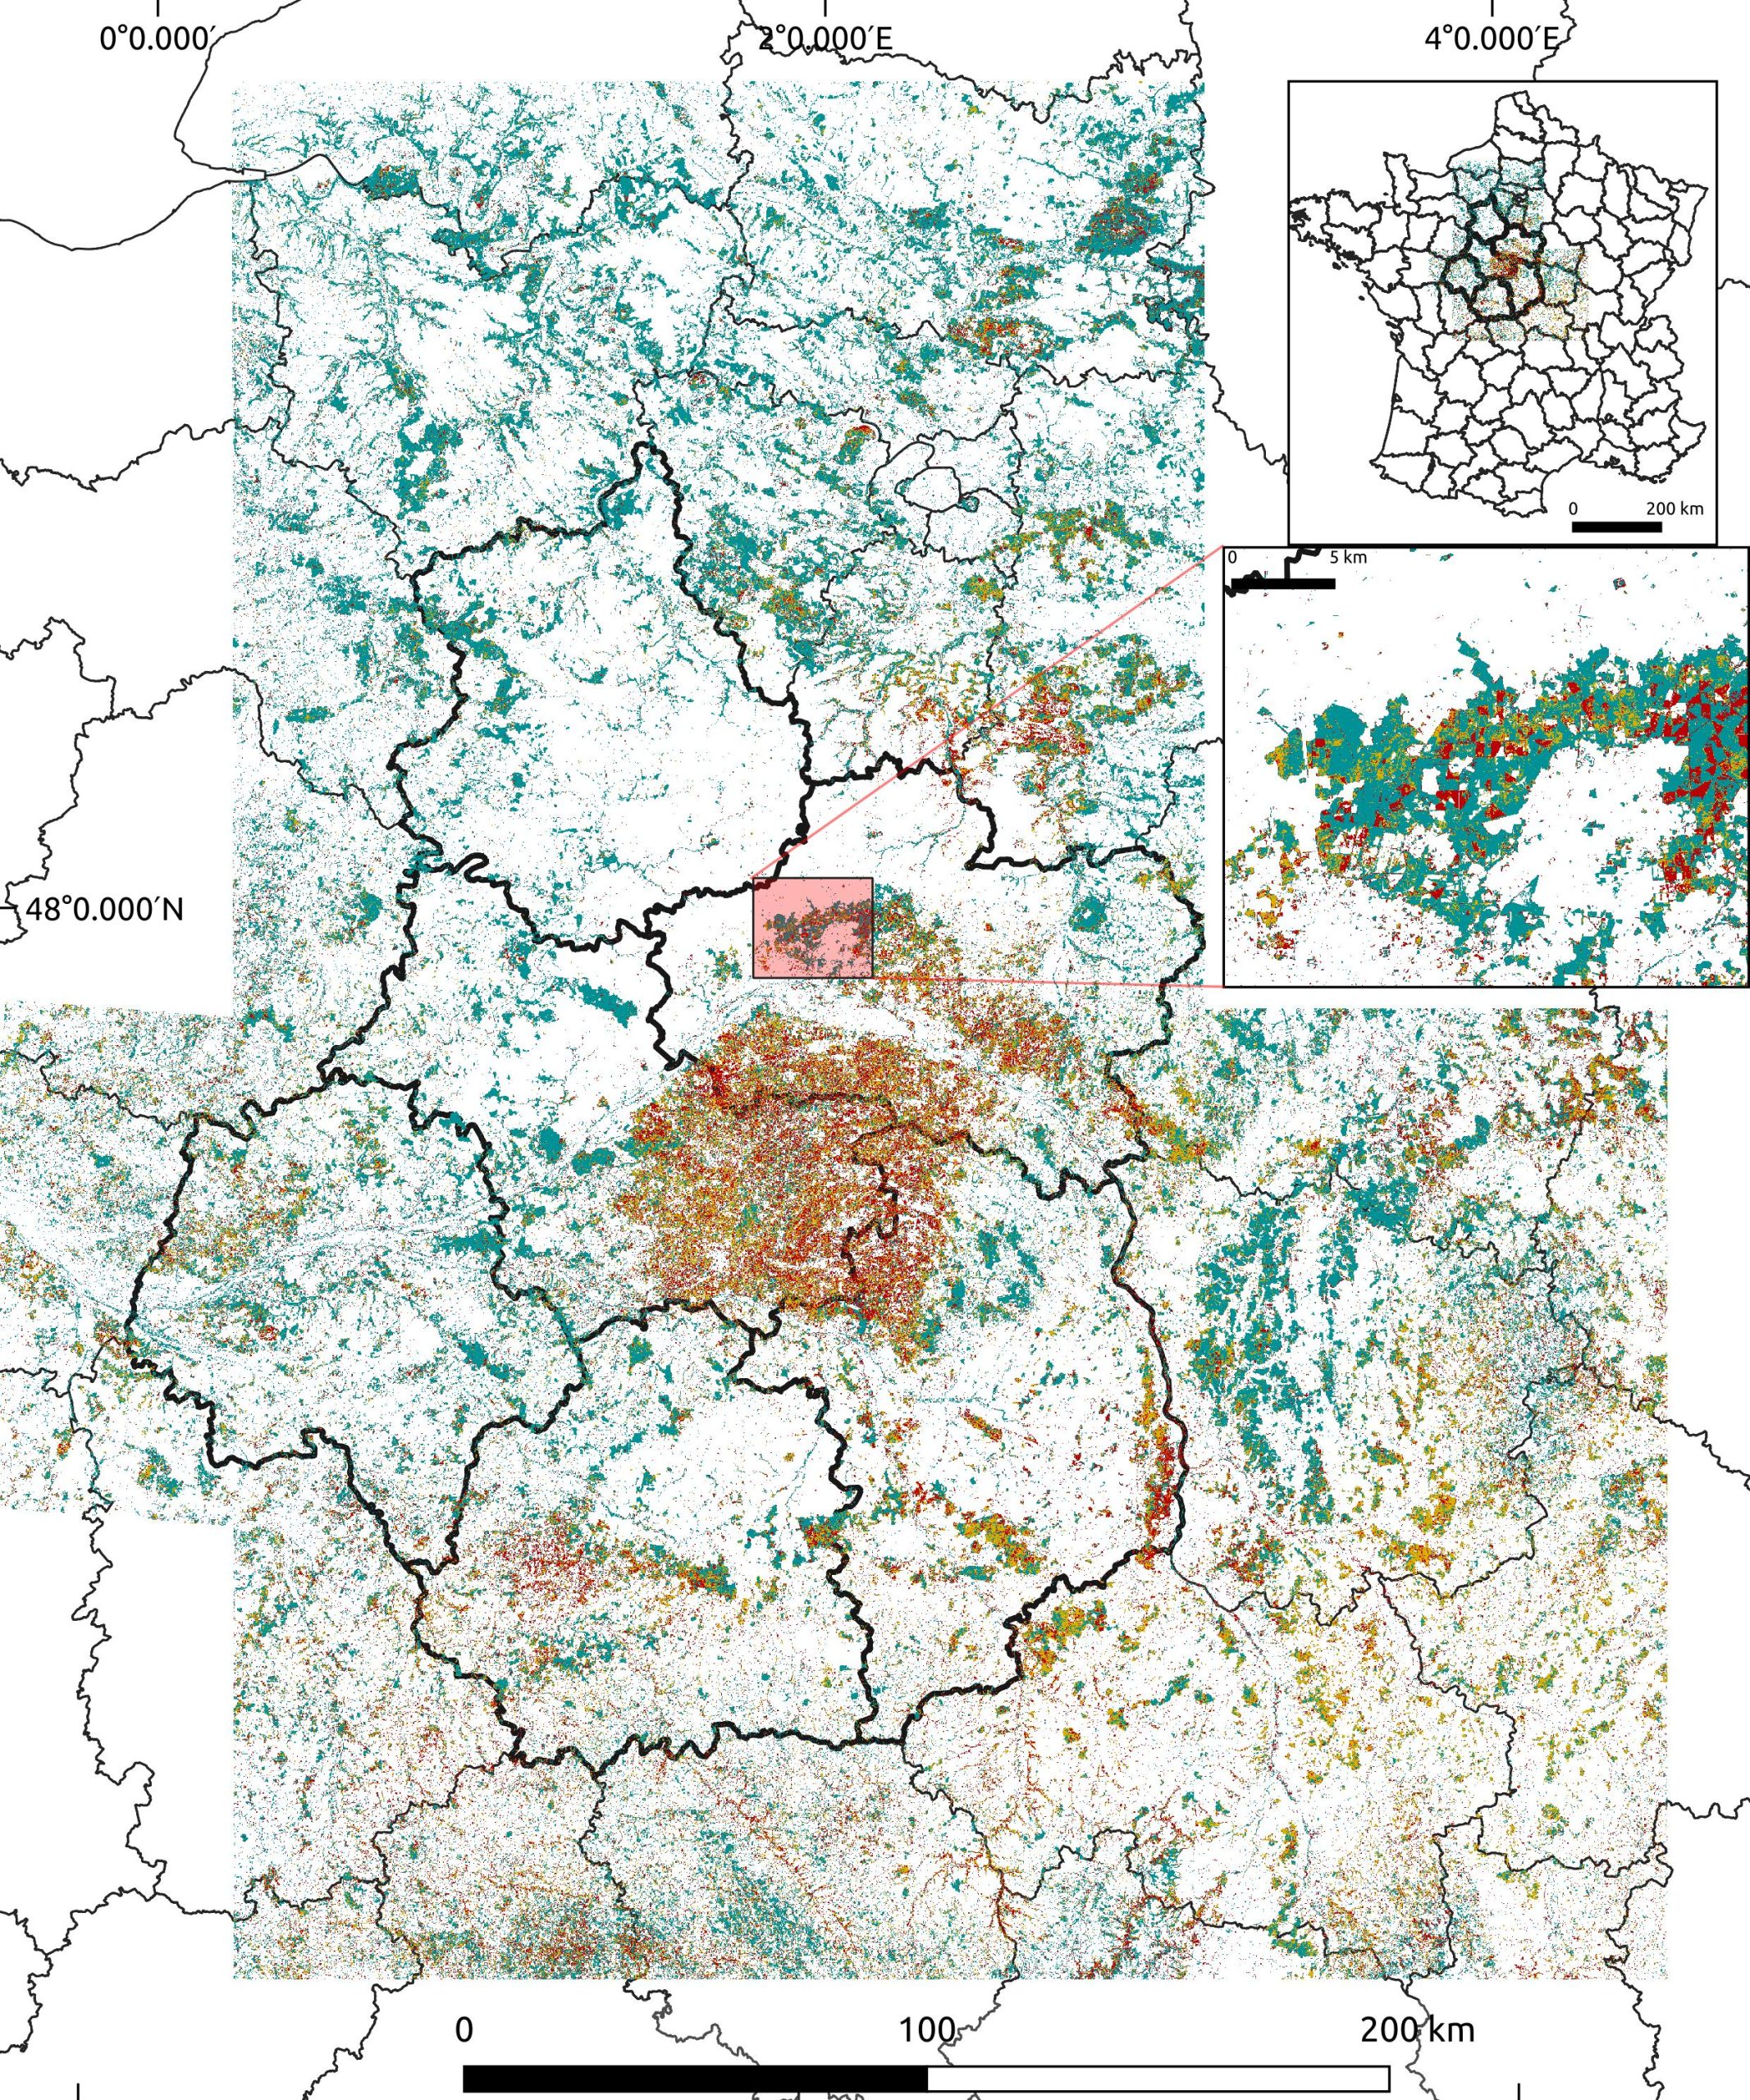
Study area and reference data
Our study area corresponds to the Centre-Val de Loire region and its surroundings (see Figure 2). The training data are plots (20 trees) labeled between 2017 and 2022 according to the DEPERIS protocol used by the Département de la Santé des Forêts (DSF, Department of Forest Health) in France. Taking into account branch mortality and lack of ramification, this protocol assigns to each tree a grade ranging from A (healthy) to F (dead). A grade of D corresponds to a declining tree with a loss of more than 50% of its crown. A plot is considered to be affected by dieback if more than 20% of the trees are declining (this is the convention used by foresters in France). In practice, we divided the plots into 3 categories according to the percentage of declining trees: healthy (less than 20%), declining (between 20 and 50%) and very declining (+50%). In total, more than 2,700 reference plots were used, half of which were labeled in 2020 during a national survey conducted by the DSF.

Method
The processing chain developed for oak dieback detection is detailed in Figure 3. A contribution of our approach is the development of a multi-year learning set, which makes it possible to obtain a prediction model that can be used to predict dieback over several years. The main motivations for this multi-year approach were 1) to take advantage of the availability of plot references acquired over several years, and 2) to continue predicting in future years without the need to recalibrate the prediction model.
As a first step, we studied different spectral indices extracted from Sentinel-2 images to identify those most suitable for monitoring oak dieback. Two complementary indices were selected: one related to chlorophyll content and the other to water content of the vegetation. As for the map production, we found that the predictions of the model learned from our raw data tended to oscillate between optimistic predictions (map with a majority of healthy pixels) and pessimistic ones (map with more dieback detected). These oscillations are caused by phenological variations and an imbalance in our training data. For example, predictions for the year 2020, which has a high proportion of healthy training data, are more optimistic than those for the year 2021, which has a higher proportion of declining training data. To improve the stability of our classifier (and its performance), we expanded our training data using a simple and intuitive procedure that can be summarized by the following two rules. Rule 1: a plot that was healthy in year Y was most likely healthy in years Y-1 and Y-2. Rule 2: a plot that was declining in year Y will most likely continue to decline in years Y+1 and Y+2. In practice (see details in the full article), the classification model used is a Random Forest and the input data are time series over two consecutive years of the two vegetation indices derived from the Sentinel-2 image described above. The training set is also balanced using the SMOTE algorithm, which generates synthetic examples in the minority classes.

Results
Our validation results show that it is possible to accurately detect oak dieback (average overall accuracy = 80% and average balanced accuracy = 79%). A spatial cross-validation was also conducted with a buffer of 10km to evaluate the performance of the model on regions that were never encountered during training across all years, resulting in a slight decrease in accuracy ( ∼ 5%). Figure 4 shows the map produced for the year 2022. It highlights the heterogeneous state of forest health within the region: the Sologne region in the center of the image, for example, is in severe decline, while the northwest is less affected. As we did not have a high quality oak mask, we decided to use the OSO deciduous mask (preliminary studies have shown that the maps produced are quite relevant for deciduous trees in general). Looking at the oak mask « BD forêt V2 (IGN)« , the percentage of pixels in decline has increased from 15% in 2019 to 25% in 2022 (these results should be taken with caution and are probably pessimistic since the mask is old and we do not have a proper mask for clear cuts). Homogeneous plots (in red) are visible and generally correspond to clear-cuts. Figures 5 and 6 allow us to appreciate in more detail the spatial resolution of the analysis and the temporal evolution of the dieback in areas located in the state forests of Orléans and Tronçais. In particular, we can see how quickly and extensively dieback can change from one year to the next.


Conclusions and perspectives
This work highlights the value of Sentinel-2 imagery for systematic forest health monitoring. Given the diffuse nature of the observed phenomenon, the use of a supervised method (here Random Forest) proved necessary. A particular feature of our approach is the development of a multi-year model that is stable enough to be used for several consecutive years. There are still many opportunities for improvement. In particular, it would be interesting to automate the data expansion stage to replace the (rigid) rules currently used. Mapping at national scale is another perspective, given the relative robustness of the model for prediction over several years and over areas outside the learning region. Switching to a deciduous model, not specific to oak, could also provide a more general production. Finally, the addition of Sentinel-1 imagery could be done to investigate whether the complementarity of the two satellites is relevant to our use case.
Acknowledgements
This post was written by Florian Mouret and Milena Plannells, it is the fruit of a collaboration between Orleans University and CESBIO.
Our warmest thanks go to the iota2 team at CESBIO (A. Vincent, H. Touchais, M. Fauvel, J. Inglada, etc.) and to CNES. We would also like to thank the various participants in the RECONFORT project (non-exhaustive list): ONF (J. Mollard, A. Jolly, M. Boulogne), CNPF (M. Chartier, J. Rosa), Unisylva (E. Cacot, M. Bastien), DSF (T. Belouard, FX. Saintonge, S. Laubray), INRAe (JB. Féret, S. Perret) and EI de Purpan (V. Cheret and JP. Denux). This work was supported by the Ambition Recherche et Développement (ARD) SYCOMORE program funded by the Centre-Val de Loire region.