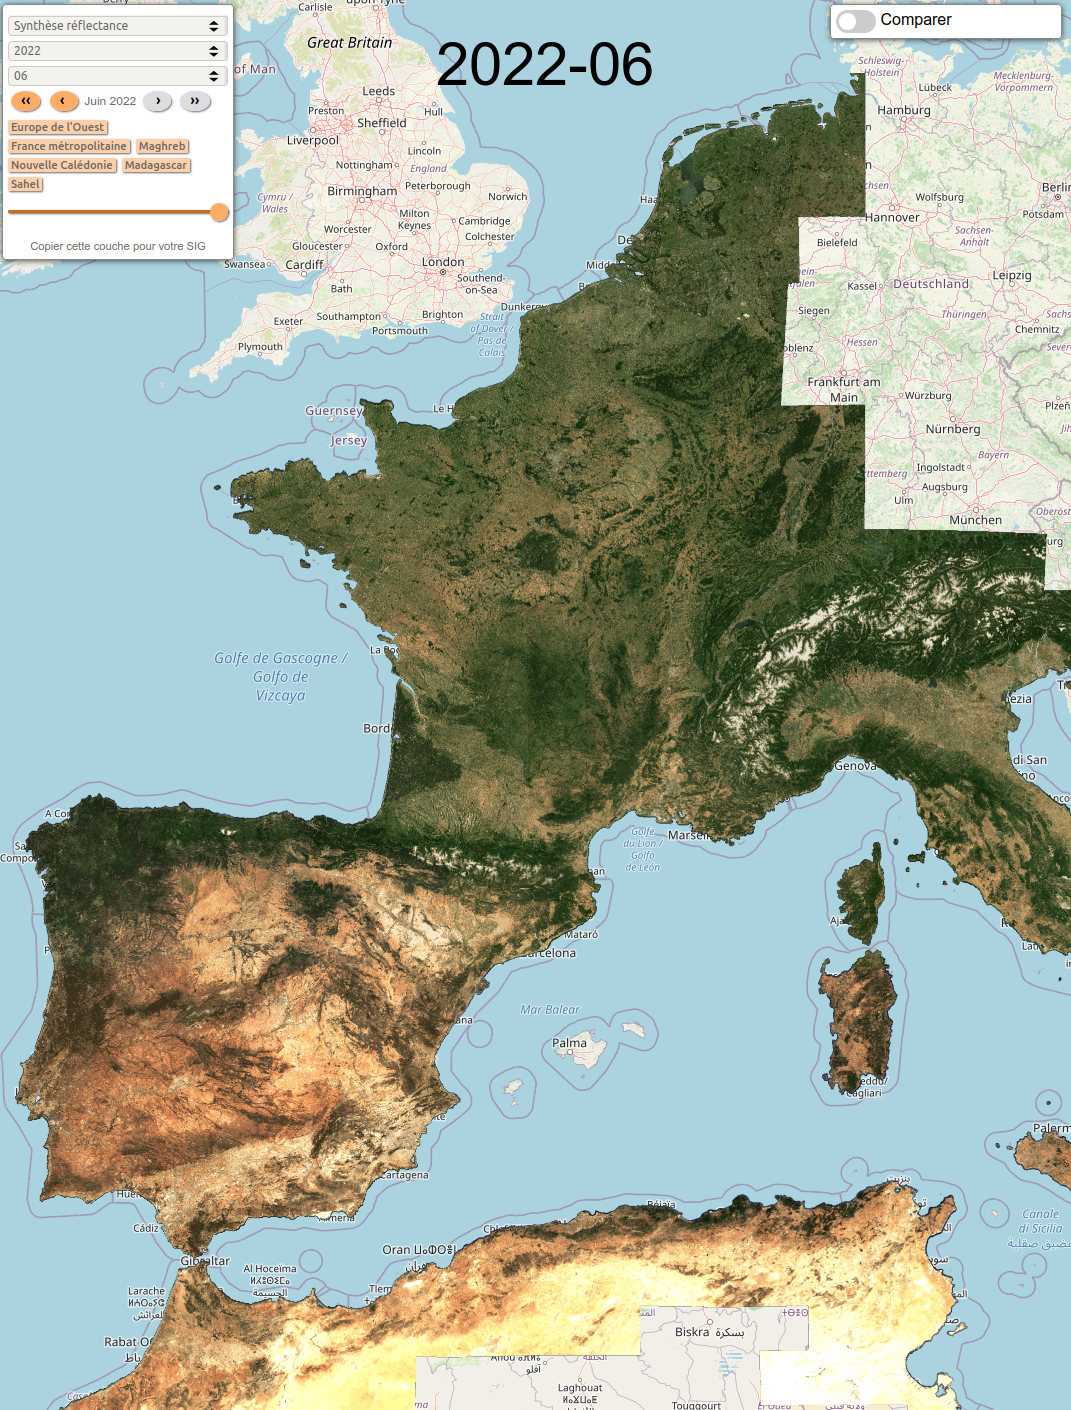
In June 2022, drought spreads to all South Western Europe and Maghreb
While Italy or Morocco have been alarmed for months, the drought has spread in June to all southwestern Europe (calling Brittany « southwestern » is a bit risky, I admit). The surface reflectance syntheses from Sentinel-2 have been delivered for the month of June a few days ago (I was on holidays), and the comparison with last year is impressive (2021 was a « normal » year in France according to 20th century standards).
Let’s begin with the view at continental scale:
These images provide monthly summaries of the light reflection coefficient from surfaces (the surface reflectance) in the blue, green and red band measured by the European Sentinel-2 optical satellites. The monthly synthesis is computed as a weighted average of the reflectances of the non-cloudy pixels. Their interpretation can be tricky. Grasslands and natural low vegetation areas are very sensitive to drought, forests resist longer, while crops are difficult to interpret because of differences in the progress of the crop cycle, and the effect of drought. Just before the harvest, wheat shows an extremely bright stage, as seen below in Belgium or in Vendée.
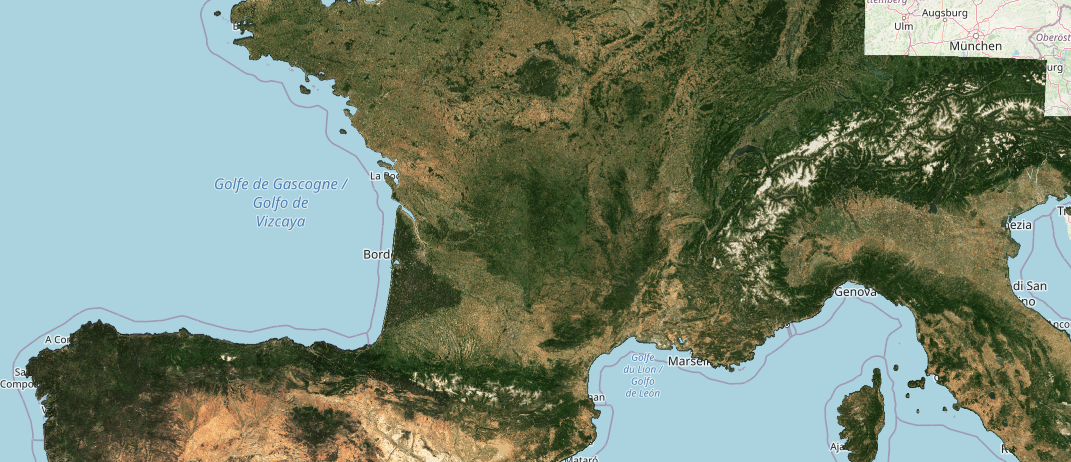
Drought even affects Brittany (her, the region of Pont-Aven)!
In June, it is particularly severe in the center-West of France (here, the region of la Roche sur Yon).

But it is also really intense in Spain, here, the farmland near LLeida, where irrigated zones seamed to resist in June, thanks to the water from the Pyrenees.
The drought is catastrophic in Italy (here the downstream catchment of the Po river), where green areas have become very rare in June. If you click on the picture, you will certainly be able to see the decrease of the river level, and the increase of the surface of sandbanks.
The Maghreb countries are usually dry at this time of the year, but in this normally irrigated area near Marrakech, we can see that the irrigated areas have decreased from the previous year, and the non-irrigated soils have become extremely bright.
The situation is about the same in Tunisia:
Belgium seemed to resist in June, and large differences on the cultural cycle progress can be observed.
The images can be viewed and compared from the nice cartographic server of Theia. Do not hesitate to explore the areas you know well. Data are produced at CNES for THEIA, at 10 m resolution. July data will be available before mid-August. The complete data, with all bands, and at full resolution, can also be downloaded from Theia’s distribution site
The processors used to produce those almost seamless syntheses are MAJA, for cloud detection and atmospheric correction, and WASP, for the monthly syntheses. These processors have been developed by CNES and CS-GROUP, using processing methods developed at CESBIO.