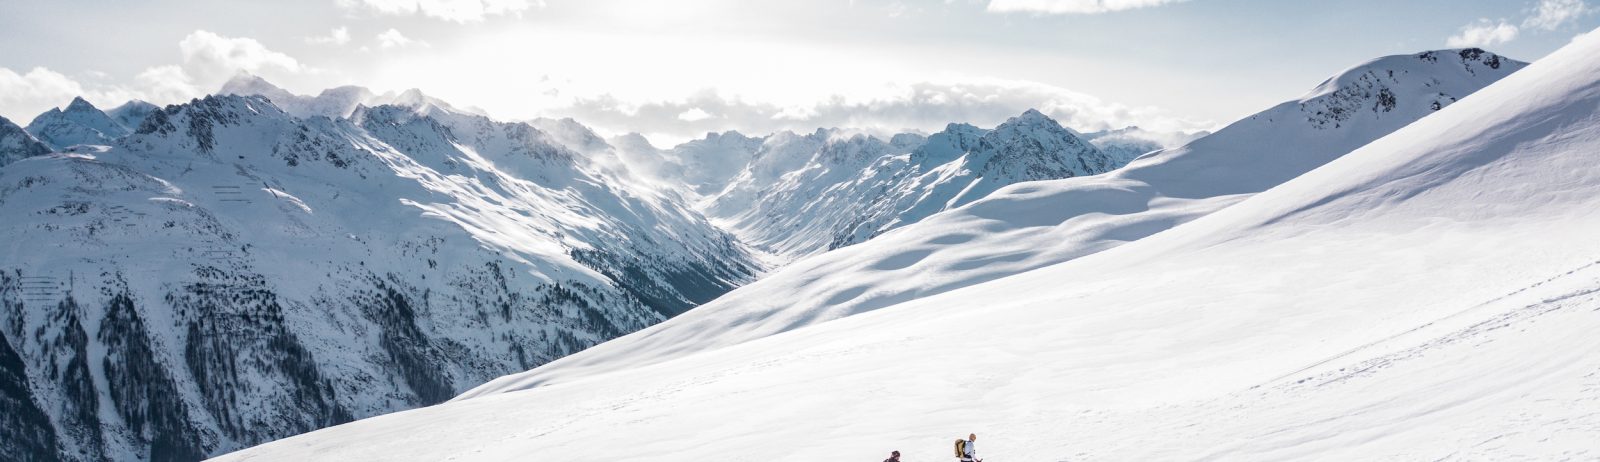
Two billion pixels to check your next ski destination
More exactly: two maps of 934’343’100 pixels!
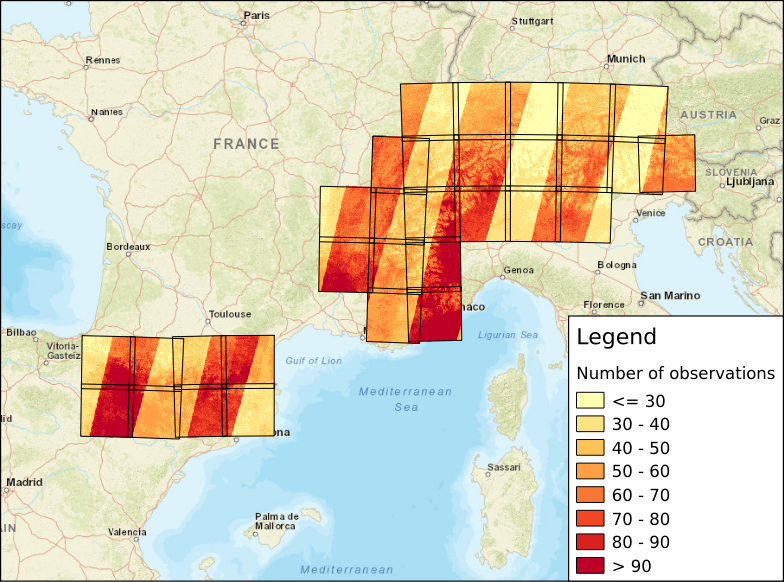
We [1] have processed 6205 Sentinel-2 images and 593 Landsat-8 images to compute the annual snow cover duration in the Alps and the Pyrenees at 20 m resolution for hydrological years 2016-2017 and 2017-2018. The snow cover duration (or snow persistence) is defined as the total number of days with snow on the ground over a hydrological year (from 01 September to 31 August). We also added the ski runs from the great OpenSnowMap project.
App link: http://osr-cesbio.ups-tlse.fr/echangeswww/majadata/simon/snowMaps.html
These maps were obtained as follows: (i) we generated snow maps from all available Sentinel-2 and Landsat-8 L2A image in Theia using let-it-snow (ii) for each tile, we obtained a time series of snow maps that was interpolated to the daily time step using this OTB module by Jordi Inglada (as explained in this post) (iii) from this stack of gap-free snow maps we compute the number of days with snow over a hydrological year. Then we applied a colormap and build the tiles at different zoom levels using gdal2tiles for a fast display in a web browser. Pixels with values below 60 days were masked out to remove potential artifacts in low elevation areas due to snow/cloud confusions [2]. We did not apply any post-processing or image filtering. All computations were done in the CNES HPC.
Caveat
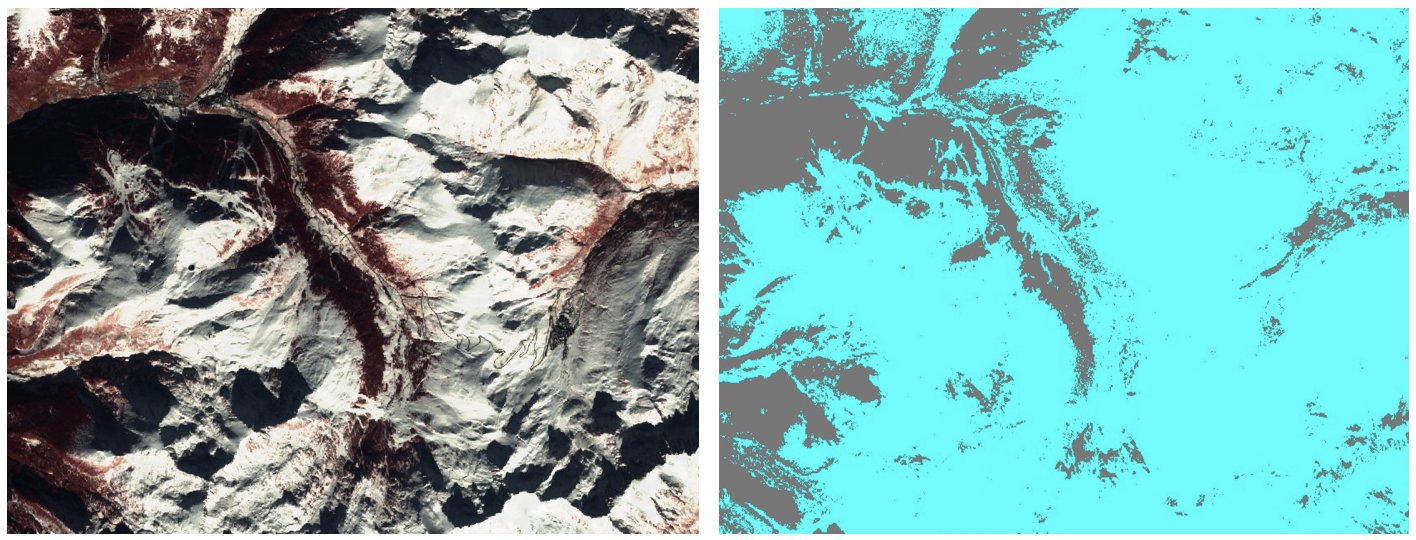
These maps are not reliable in forest areas because optical sensors like Sentinel-2 and Landsat-8 do not « see » through the vegetation. In particular the snow is generally not detected below the canopy of dense evergreen forests. As a result the computed snow cover duration can be higher in the valley bottoms than in their surrounding slopes, because valley bottoms are often deforested for agriculture, while the slopes are covered by forests. This effect is well visible in the 2017-2018 snow cover duration map because the snow stayed for a long time at low elevation.
Snow is not only for skiing! We anticipate that these data could be also useful for other applications in ecology, hydrology etc. Our intention is to release these products on a yearly basis via Theia. In the meantime your feedback is more than welcome!
Edit : Follow this link for an update of these maps midway in the 2019 snow season: Near-real time analysis of the 2018-2019 snow season in the Pyrenees and the Alps from satellite data)
Acknowledgements
This work was partly done within the CLIM’PY project/OPCC. The processing was done using the new « datalake » at CNES. Thanks to Christophe Taillan and the HPC team at CNES for the support! And thanks to Michel Le Page for helping us with the web interface.
Footnotes
[1] Germain Salgues, Manuel Grizonnet and myself
[2] 60 days is the threshold to separate the seasonal snow from the ephemeral snow in the seminal paper of Sturm, M., Holmgren, J., & Liston, G. E. (1995), A seasonal snow cover classification system for local to global applications. Journal of Climate, 8(5), 1261-1283.