Vegetation recovery in Saint Barthélemy after Irma
Last year, in this post, I showed the comparison of two Sentinel-2 images of Saint Barthélemy in the Caribbean before and after the powerful Hurricane Irma.
A new feature in the EO Browser enables to plot the evolution of the mean NDVI within a polygon. I drew a rough polygon of Saint Barthélemy to check the evolution of the vegetation after Irma from Sentinel-2 data.
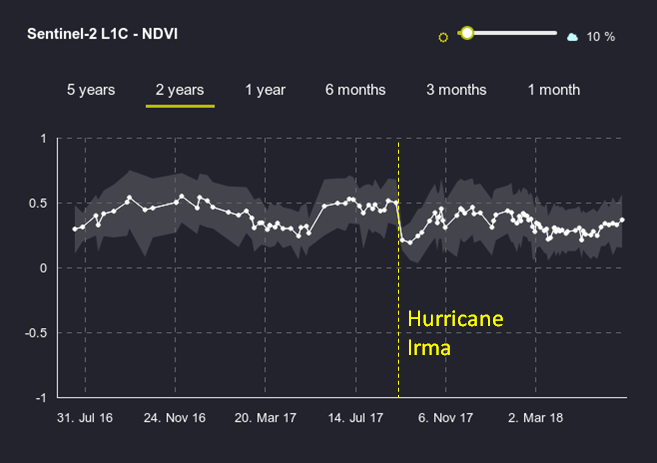
Here I used L1C data but it is also possible to use the L2A products from ESA, although these data are not always available. I manually adjusted the cloud fraction to remove the most obvious artifacts in the mean NDVI due to cloud contamination (clouds cause abrupt drops in the NDVI) [1].
This nice tool is sufficient to see that the vegetation quickly recovered after the hurricane, in about 1 month [2]. Catastrophic disturbances like hurricanes are actually known to contribute to maintain tree species diversity in tropical regions [3]. In the cities, according to Le Point, most of the damages have been repaired and the island is almost back to normal. This is good news for the people of St Barth!
Notes and references
[1] Under the hood, it’s a « local area cloud detection algorithm based on the Braaten-Cohen-Yang method » Milcinski, G. Multi-year time series of multi-spectral data viewed and analyzed in Sentinel Hub. Medium, Apr 5, 2018.
[2] This is very similar to what has been observed in other tropical areas, e.g. « a sudden drop in NDVI values after Hurricane Maria’s landfall (decreased about 0.2) which returns to near normal vegetation after 1.5 months », Hu, T., & Smith, R. B. (2018). The Impact of Hurricane Maria on the Vegetation of Dominica and Puerto Rico Using Multispectral Remote Sensing. Remote Sensing, 10(6), 827.
[3] Vandermeer, J., de la Cerda, I. G., Boucher, D., Perfecto, I., & Ruiz, J. (2000). Hurricane disturbance and tropical tree species diversity. Science, 290(5492), 788-791.