CHAAMS
Global Change: Assessment and Adaptation to Mediterranean Region Water Scarcity
In a context of high stress on water resources and agricultural production at the global level, together with climate change marked by an increase in the frequency of these events, drought is considered to be a strong threat both socially and economically. We have designed and developed a prototype web application to facilitate the exploration of drought indices. The application proposes to explore two indicators based on vegetation indices from remote sensing (MODIS), an indicator based on soil moisture derived from the ASCAT scaterrometer, and rainfall accumulation. As for today, MEDI covers the useful areas of the three Maghreb countries: Algeria, Morocco and Tunisia. MEDI has been developed within the frame of the ANR AMETHYST project (2013-2018).
Main actions within the Chaams project (WP6) will be: (1) to strenghen the tool by adding new higher level indicators of agronomical drought developped within the frame of WP2; (2) to extent the domain of application towards the MENA region; (3) to promote the use of the MEDI tools towards the stakeholders involved on the four catchment of the project through training sessions.
Web site: MEDI application
Development: M. Le Page
Document: Le Page Michel, Mehrez Zribi, « Analysis and Predictability of Drought In Northwest Africa Using Optical and Microwave Satellite Remote Sensing Products », Nature Scientific Reports, SREP-18-29430 , DOI : 10.1038/s41598-018-37911-x , accepted December 2018
Description of the MEDI application
The data sources used in the application in its current state are :
- The NDVI obtained from the MODIS MOD13Q1 product of the TERRA satellite, a 16-day global synthesis at 250m of spatial resolution.
- The SWI obtained from the SWI product of the ASCAT satellite, a daily summary at 0.1 deg spatial resolution.
- The rains extracted from the CHIRPS product (Climate Hazards Group InfraRed Precipitation with Station data). We used the monthly rainfall totals at 0.5 ° of spatial resolution. CHIRPS combines satellite images and measurements of in-situ stations.
- The administrative areas come from GADM (Global Administrative Areas)
| The following indicators are then computed at a monthly time step and updated as soon as new data are made available. : NDVI: Normalized Difference Vegetation Index NDVI = (PIR-R) / (PIR+R) where: PIR is the reflectance in the Near Infra-Red band R is the reflectance in the Red band For bare soils, the reflectances being of about the same order of magnitude in the red and the near infrared, the NDVI is close to 0. Vegetation has positive NDVI values, generally ranging between 0.1 and 0.7 depending on its density. VAI: Vegetation Anomaly Index VAI = (NDVI-NDVImean) / (NDVIdev) where: NDVI is the NDVI of the current month. NDVImean and NDVIdev are the NDVI average and standard deviation of the studied month, respectively. The VAI index is centered on zero. Negative values indicate a probable water stress situation. VCI: Vegetation Condition Index VCI = (NDVI-NDVImin) / (NDVImax-NDVImin) where: NDVI is the NDVI of the current month. NDVImin and NDVImax are the minimum and maximum of NDVI of the studied month. The VCI index varies between 0 and 1 corresponding to conditions that vary from extremely unfavorable to optimal. MAI: Moisture Anomaly Index MAI = (SWI- SWImean) / (SWIdev) where: SWI is the Soil Water Index of the current month. SWImean and SWIdev are the average and standard SWI deviation of the studied month, respectively. The MAI index is centered on zero. Negative values indicate a probable water stress situation. |
Each of the indicators is synthesized for the administrative regions of the study area. The input data being relatively large, a specific time-space synthesis algorithm has been developed.
The interface (see below) is composed of a map and three interactive graphs linked together:
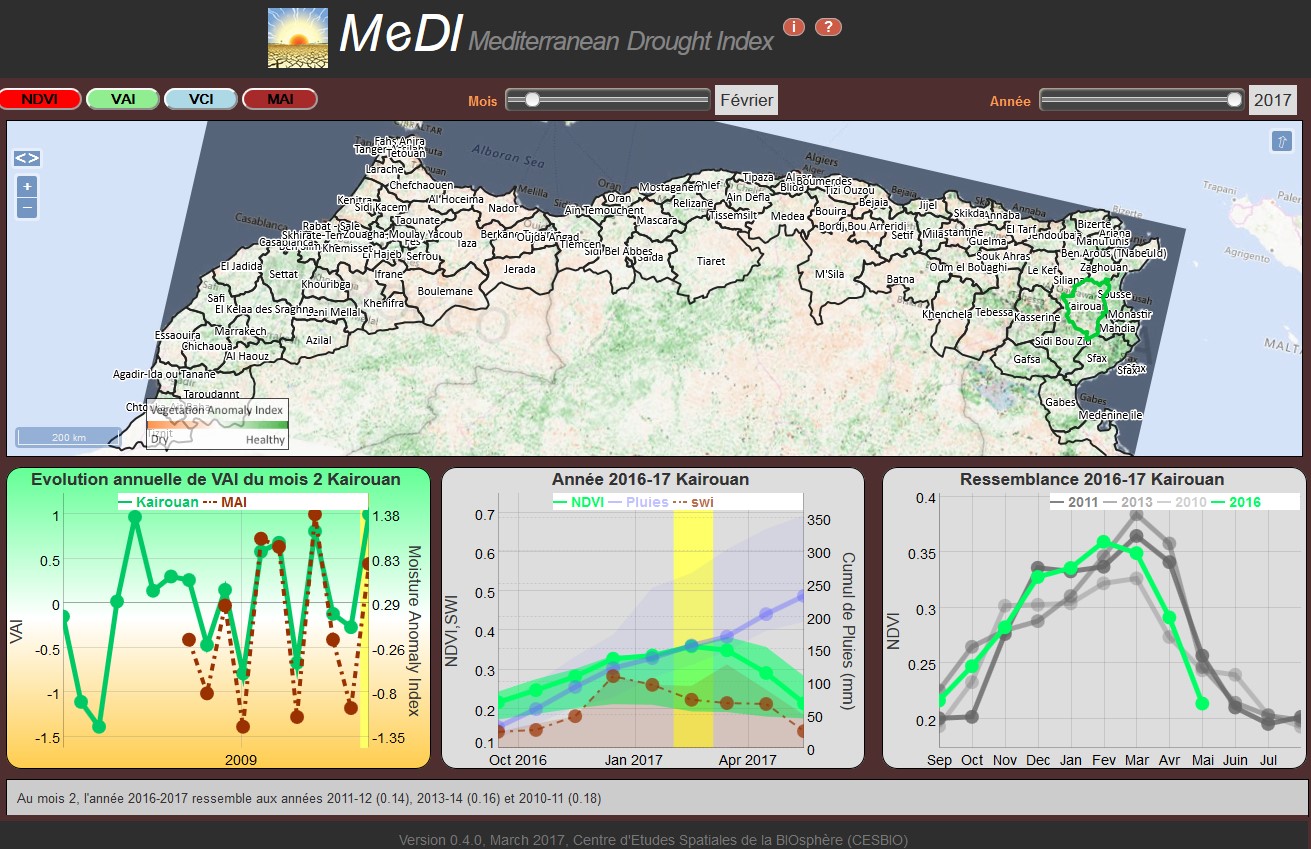
The user chooses the indicator to display on the map (NDVI, VAI, VCI, MAI) and the date of his choice. The user clicks on an administrative area to display three graphs:
- The annual indicator of the selected month allows exploring some 15 years of data and helps the user to locate the drought indicator in relation to other years. This graph combines the MAI indicator with one of the vegetation-based drought indicators (NDVI, VAI and VCI). For example, if the user has chosen to study the month of January, the chronology of the different months of January is displayed.
- The second graph allows studying the selected year from September to August. This graph does not show the drought indicators, but their primitives (NDVI, SWI and rain). For each of these primitives, the minimums and maximums of the study period are also displayed for each time step so that it is easy to identify whether you are on a « good » or « bad » year for this administrative area.
- Finally, a third graph looks for the most similar years compared to the current year. For example, if the user is located in the month of February 2017 in the governorate of Kairouan, a calculation is made to find the three closest years, in this case the years 2011-12, 2013-14 and 2010-11