WP2 « Characterization and monitoring of physical mediums » (Z. Lili-Chabaane and J. Ezzahar)
Lead : INAT/UCAR and ENSA/UCAM
The WP2 aims to provide a database by integrating remote sensing data with mostly existing in situ datasets (micro-meteorology, isotopy, piezometry …) and geographical information systems with the ultimate objective to better describe the states of physical environments at the level of the soil-vegetation-atmosphere (SVA) interface, key parameters for a better understanding of the continental water cycle (WP4 and 5) as well as for decision making tools (WP6). This database will include the properties of soil, of the aquifers and the hydrological network, soil moisture (SM), vegetation cover, crop dynamic and stress indicators and snow mapping. It will rely heavily on the long-term research observatories implemented on the pilot sites and up-to-date remote sensing products mostly developed by the consortium members and distributed by the THEIA land data services (https://www.theia-land.fr/en). We will also exploit the available long time series (MODIS, AVHRR, GRACE and scatterometers data) to analyze the dynamics of these properties over long periods of time and especially in response to extreme events (drought).
Proposed tasks
2.1 In situ observation analysis
Input: pilot site observatories / Output: Task 2.2-WP4-WP5
The first task is to conduct a comprehensive analysis of existing static information and data on water reservoir and water uses (geometry of the aquifers, geology and hydrogeochemistry, data bases of wells, exploitation). Each catchment is covered by a network of meteorological stations to feed the integrated hydrological models (WP5) and the crop water consumption model (WP4) and a network of hydrological measurements (i.e. water table level and streamflows) for their calibration. Disagregated rainfall estimates based on re-analysis and stochastic weather generators will be also provided on some of the pilot sites. Three of the four research observatories (Lebna, Merguellil and Tensift) have carried out several experiments sampling the water budget, the vertical exchanges, evapotranspiration -ETR- partition into soil evaporation and plant transpiration and the canopy bio-physical characteristics (above ground biomass, leaf area index -LAI-) of the main crops and irrigation systems of region. Litani and Tensift includes also some snow stations. These data will be used to validate the remote sensing products in task 2.2 and model’s outputs (WP4-WP5).
2.2 Remote sensing of surface properties
Input: – / Output: Task2.3-WP4-WP5
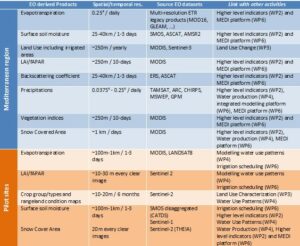
We will mostly exploit existing and/or operationaly delivered products (listed in the table below): the high resolution (1 km) SM products derived from the SMOS instrument released by the ground segment of the SMOS mission (https://www.catds.fr/); vegetation status indicators at 10 to 20 m resolution (including NDVI and LAI) and high spatial resolution crop group/type maps from the S2Agri toolbox (Sentinel-2 for Agriculture, funded by the European Space Agency) for the recent years; historical land use from MODIS data at 250 m. resolution from 2001 to present (Le Page et al., 2012). The Sentinel-2 snow cover product will be extended to the Litani basin. New instantaneous maps of ETR and crop water stress based on a combination of land surface temperature -LST- (MODIS at medium scale resolution and LANDSAT8 at high resolution) and energy budget modelling will be provided on the pilot sites.
2.3 Remote sensing drought indicators
Input: Task2.2 / Output: WP5-WP6
The vegetation state growth and SM anomalies will be produced based on existing time series since the beginning of the 2000s. In addition, rainfall use efficiency indices through integration of NDVI, disaggregated rainfall estimates, ETR and soil moisture time series; irrigation use efficiency will be computed on targeted hot spots where irrigation water inputs are available. Higher level drought indices and maps based on multi-sensor products (vegetation indices, ETR, crop stress, SM and LST) will be developed considering a mixture of different anomalies coming from vegetation and soil by integrating information temporally on the key phenological stages of the main crops. Those new high level drought indicators will be used to feed the Mediterranean Drought Index platform.
Deliverables:
- D2.1 In situ observation data base over the four studied sites report M9
- D2.2 Report on analysis of in situ observations M18
- D2.3 Report on remote sensing mapping of land surfaces M21
- D2.4 Maps of land surface properties M24
- D2.5 Report in analysis of extreme events through satellite time series M24