Towards 3D time series

In our a priori definition of Sentinel-HR mission, we had included an option to observe the 3D topography at a high resolution, with a moderate accuracy ambition (lower than that offered by the CO3D satellite, as shown in the table below), but globally and with a systematic revisit.
But our mission advisory group insisted, and the option has become one of the essential charactestics of Sentinel-HR. This post gives some examples of the potential applications of such a mission
| ASTER | CO3D | Sentinel-HR | |
|---|---|---|---|
| Image resolution | 15 m | 0.5 m | 2 m |
| Resolution of elevation model | 30 m | 4 m (free at 12 m) | 10 m |
| Altimetric uncertainty (CE90) | 10 m | 1 m | 4 m |
| Cloud free periodicity | Monthly to yearly | 4 years | 3 months |
| Operations | 1999 – 2023 | 2024 – | 2028 ? |
Glaciers and Ice caps
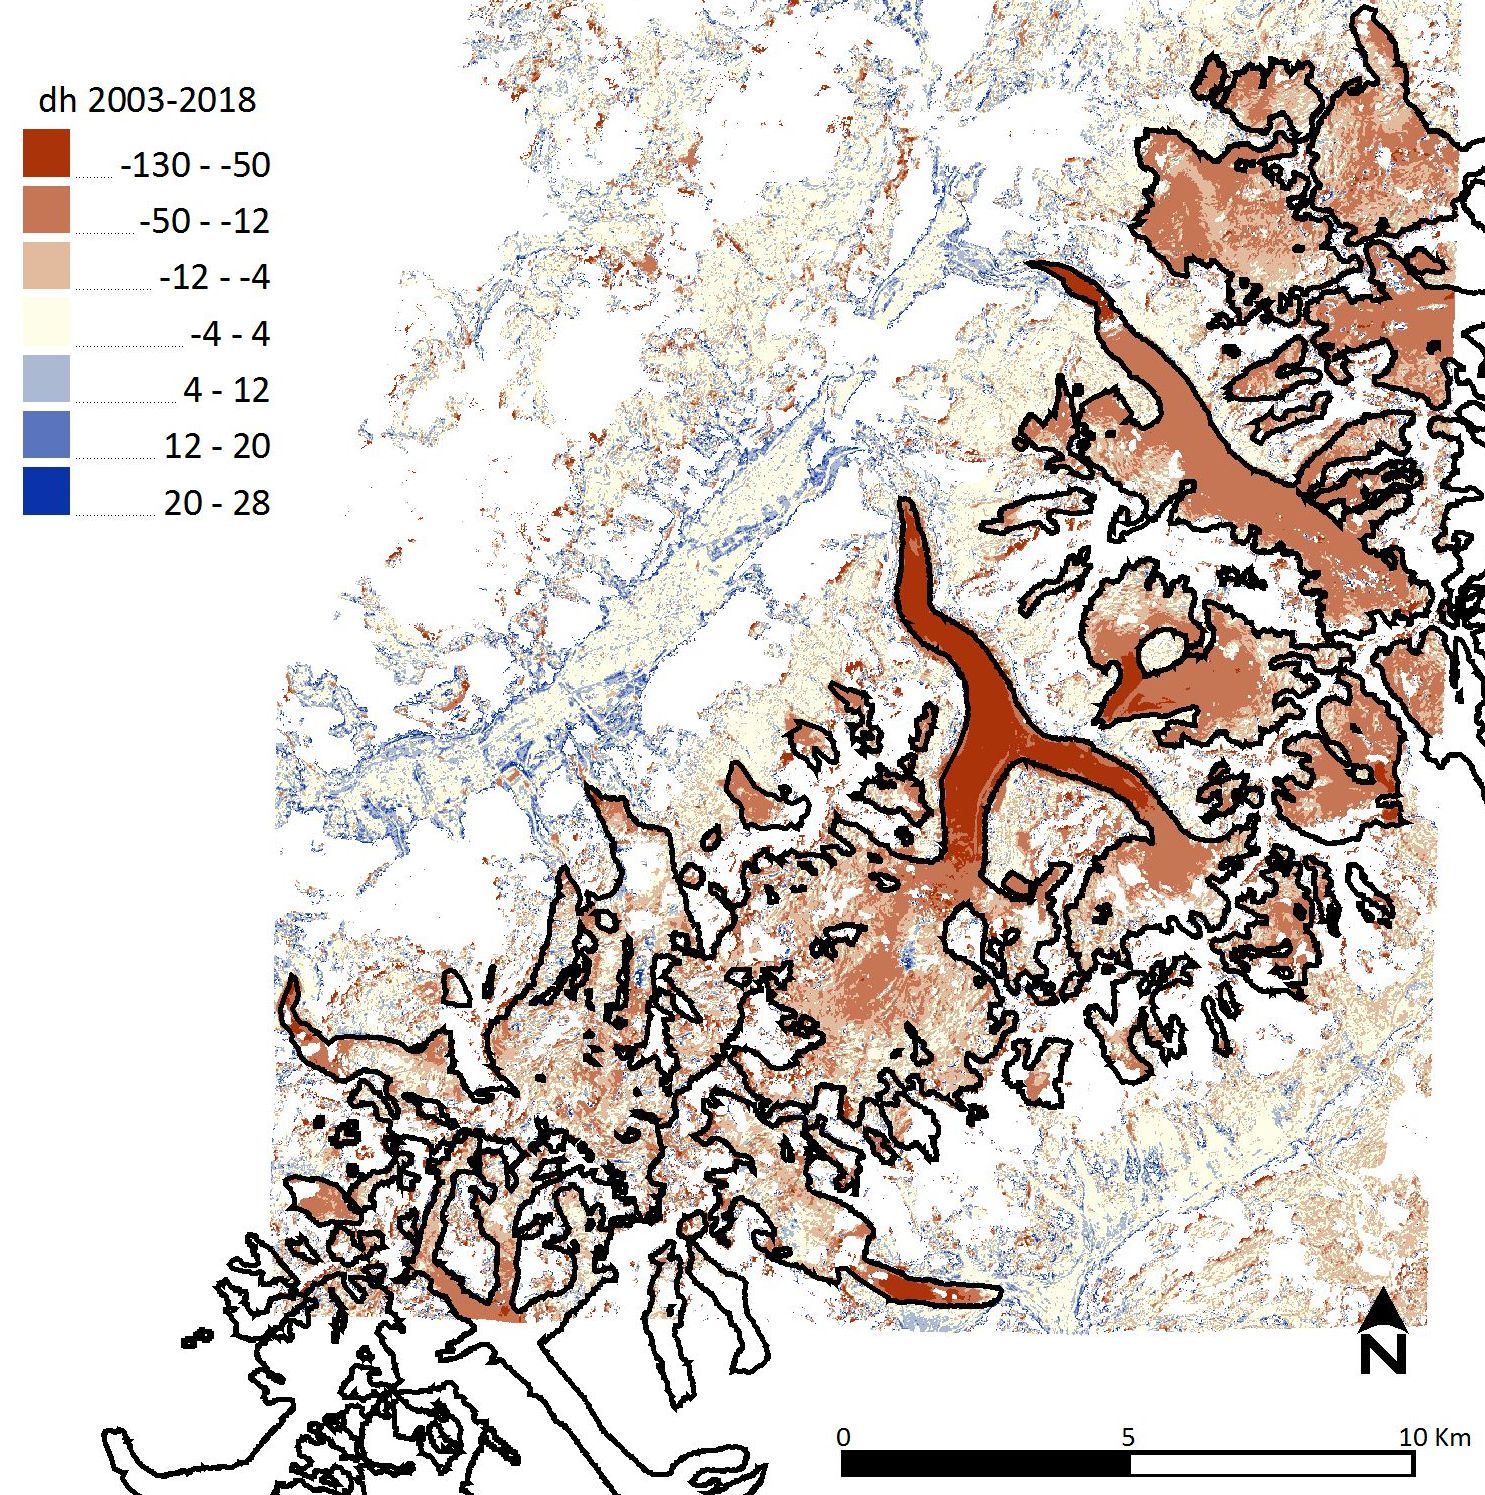
Our glaciologists have been the most enthusiastic about the inclusion of 3D in Sentinel-HR. The objective is to measure the seasonal and multi-annual evolution of glacier and polar ice sheets thickness, one of the essential climate variables (ECV). An accuracy of 4 m in 90% of the cases is enough to measure the evolution of these glaciers over a few years. Using similar but less accurate data, obtained over the very long term with the ASTER instrument on the Terra satellite launched in 1999, Hugonnet et al were able to map the global variations (mostly decreases 🙁 ) of the thickness of glaciers around the world, between 2000 and 2019.
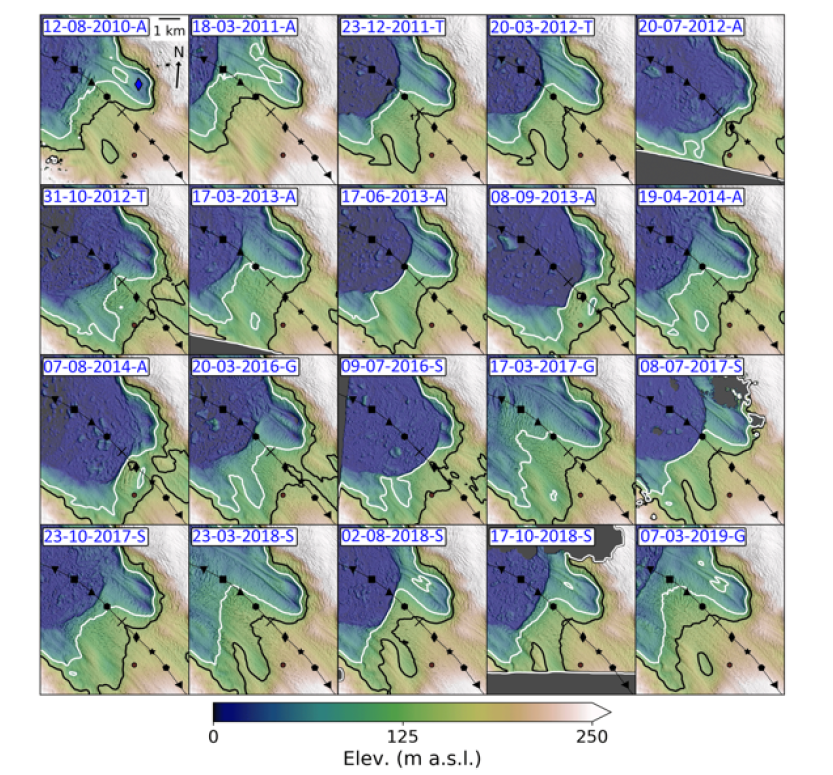
For the polar ice caps, the annual change is even stronger, and it is interesting to monitor the seasonal variations as shown in the figure below, which shows the variation of ice thickness at the limit between land and sea in Greenland.
Unfortunately, the ASTER mission is planned to end in 2023, after 24 years of good service, with no follow-on mission, except if Sentinel-HR turns out to be successful. The CO3D mission will allow to monitor some 50 glaciers, but according to the Randolph Glacier Inventory, there are about 220 000 glaciers on Earth, with an accumulated surface of 700 000 km². Monitoring so many glaciers cannot be done with the current mission.
Volcanoes, landslides, erosion
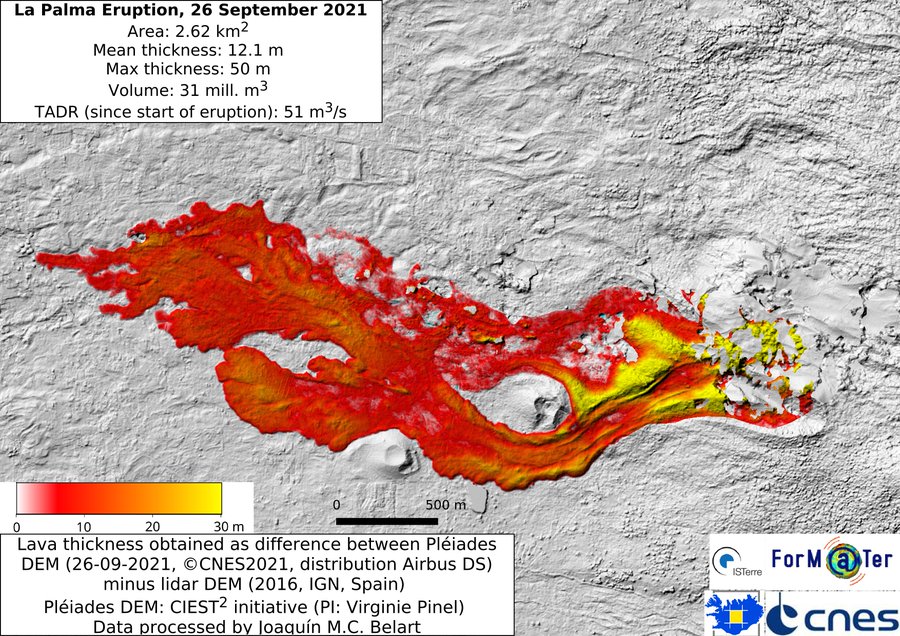
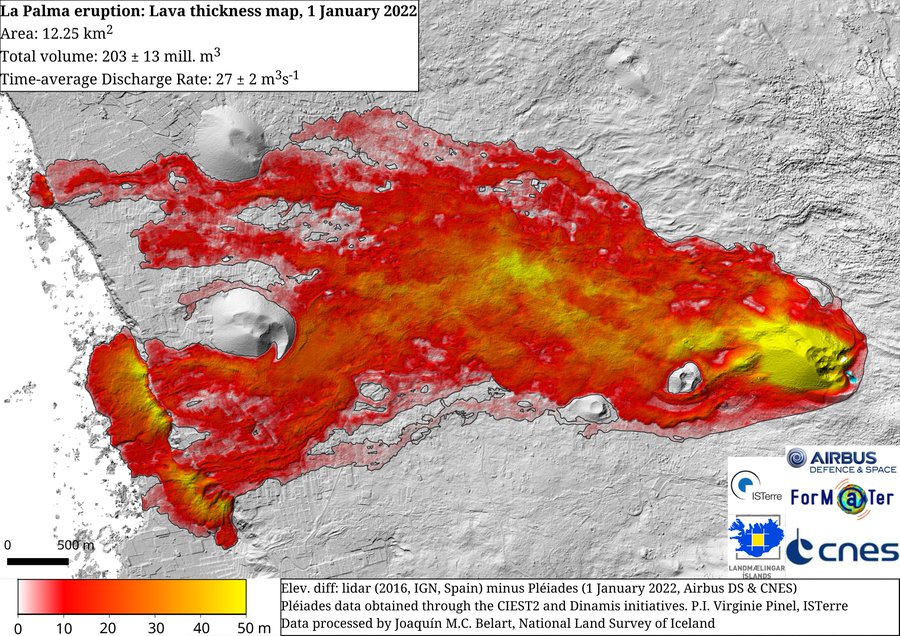
A bit like for glaciers, the possibility to observe with Sentinel-HR the 3D changes would allow to follow the evolution of volcanic flows. As shown in the image below, it is already possible to obtain this information with tasked satellites such as Pleiades, but it may be difficult to obtain this information on all the volcanoes of the world, and we would sometimes miss the situation before the beginning of the eruption.
 |  |
|---|
Evolution of lava volume for the 2021 eruption in la Palma, measures with Pleiades stereoscopic images in September 2021 and January 2022. (Crédit: V. Pinel, Isterre et J.M.C. Belart, LMI Iceland).
The knowledge of elevation variation with a frequent and systematic revisit will allow to measure the volume of eroded rocks or sediments. it will also be possible the movements of sand dunes or of landslides, with an evaluation of the slope and of the associated risks.
Water bodies
Altimetric satellite missions such as Jason, Sentinel-6 of SWOT measure the height of water, but to obtain the volume which is generally the seeked quantity, it is necessary to know the bathymetric profile of the water bodies. A mission such as Sentinel-HR will be able to do so at low water periods, and therefore, a good revisit is needed to be sure to get the acquisitions at the best moment.
Sentinel-HR could even make it possible to map the depth of the snow cover in certain mountain regions which receive heavy snowfall and thus help better predict the water resources available in the spring. The 4 m altimetric uncertainty is a bit high, but of course, it should be reduced by averaging over a neighborhood.
Cities
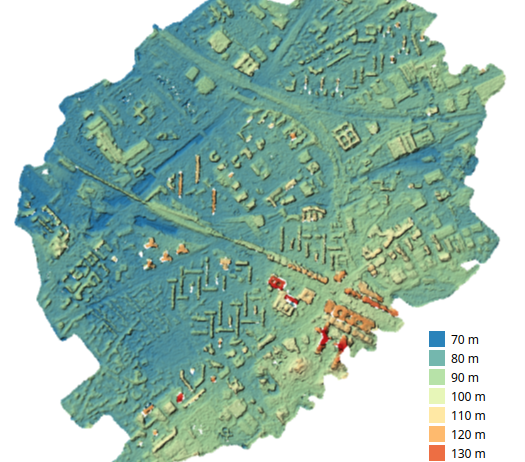
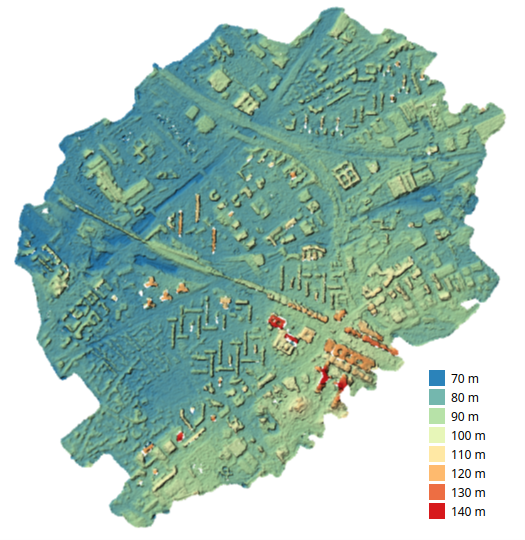
With a 4 m altimetric accuracy, it will be possible to measure the height of buildings with an accuracy of 1 floor. The height of building is an essential information to estimate habitat density. 3D also allows to monitor urban sprawl and accurately detect new buildings. Knowing the height of buildings is also important to model urban climate, because of their effect on air flow and cas shadows. The image below, obtained during Sentinel-HR phase 0 shows the expected accuracy obtained with a base/height ratio of 0.2 and a ground sampling distance of 2 m.
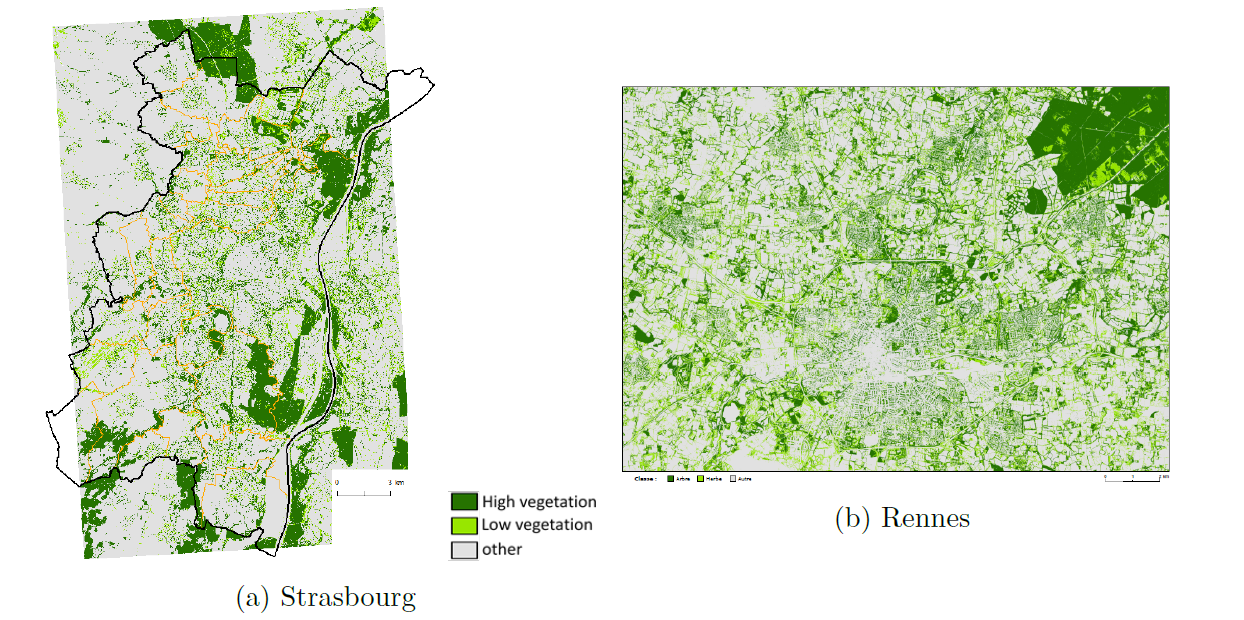
For a better modeling of the climate in cities, it is not only necessary to have a map of the vegetation, but also to know its height, a bush does not have the same cooling effect as a tree. The Sentinel-HR mission will allow to follow the evolution of the vegetation height, which is quite variable with time depending on the development and urbanism works.
Forests, trees
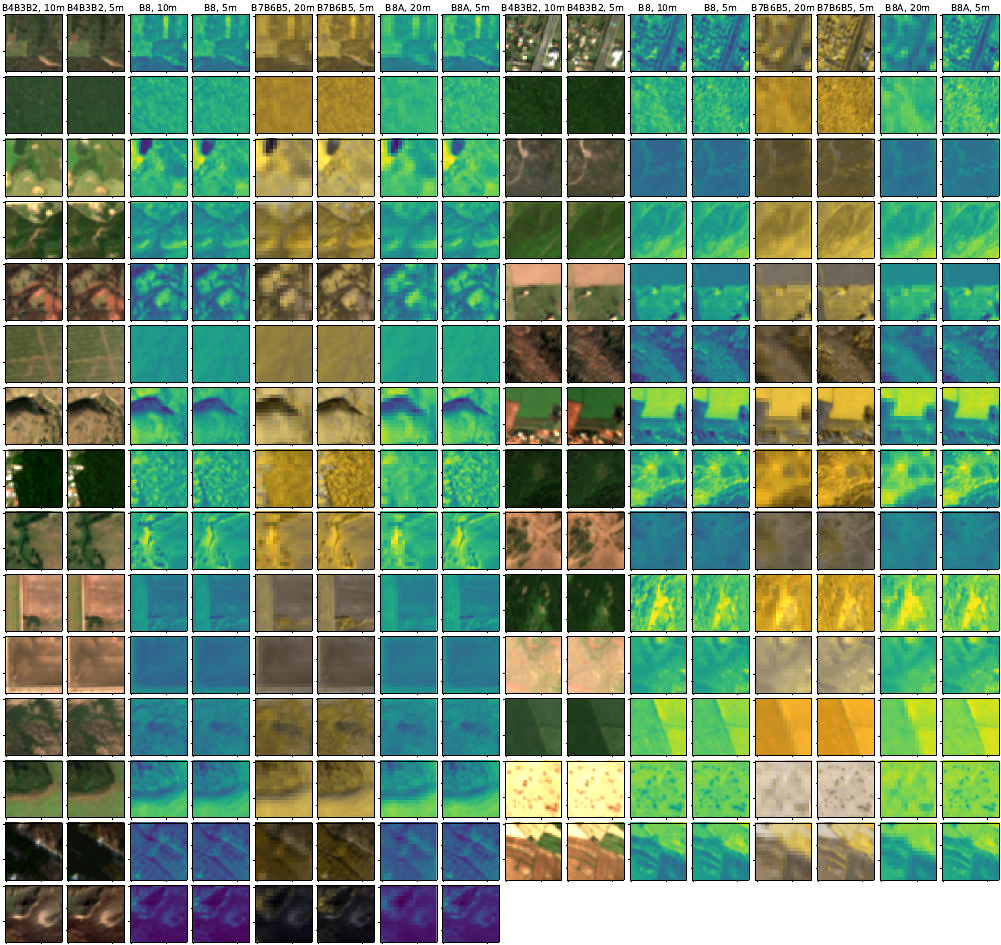
As with urban vegetation, multi-temporal 3D information will provide insight into tree height and its evolution, which can be used in machine learning methods for estimating forest characteristics. Validation with Lidar data such as those from the GEDI Lidar onboard the International Space Station will allow for a good estimation of uncertainties and refinement of the models. The tree height information will allow better classification of different vegetation types, accurate detection of forest harvesting, and estimation of exported biomass.
Bathymétrie et continuité côtière
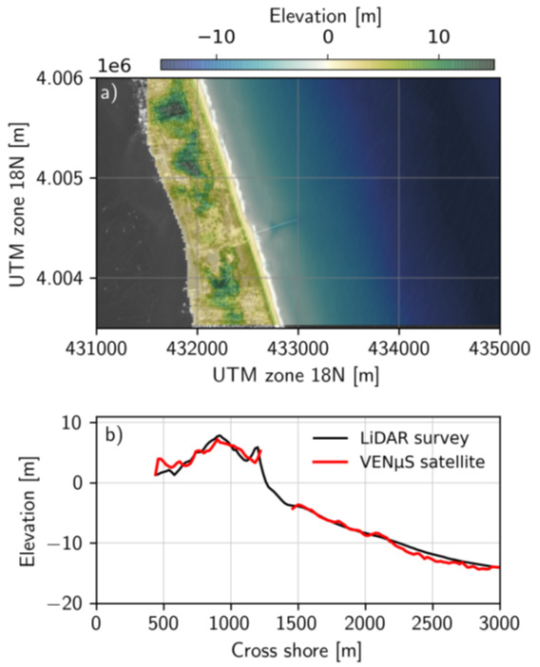
It is difficult to measure both the emerged and submerged coastal profile in its continuity. Bergsma et al 2021 showed that coastal bathymetry can be inverted from the speed of wave trains. Thus, it is not directly the stereoscopy that is used, but the slight temporal difference between the two observations. Of course, for the emerged part, stereoscopy allows to measure the relief. These methods applied to the VENµS satellite have made it possible to observe the coastal profile in its continuity. As the inversion of the bathymetry requires particular conditions (presence of waves), a revisit will be necessary.
Conclusions
The possibility to include stereoscopy in the Sentinel-HR mission, which we had initially considered as an option, has many applications, of which we have only mentioned the most obvious here.
In summary, for a mission dedicated to change detection for map updating, relief observation has a huge advantage: surface reflectance changes may be seasonal or meteorological in origin, while the changes visible in 3D are real changes.
Of course, periodic observation in 3D has a high cost. In the case of a Sentinel-HR mission with CO3D-derived satellites, it requires an increase from 6 satellites for the imaging mission alone, to 12 satellites if we want a 20-day revisit for 3D or 9 satellites, if we decide to decrease stereoscopic acquisitions to 40 days. If the additional cost seems high, it should be considered that the imaging mission would require some redundancy to compensate for the possible failure of some satellites. The fact of having additional satellites for 3D would therefore contribute to securing the mission.
This article has been written thanks to the Sentinel-HR phase-0 study report, edited by Julien Michel from CESBIO, from the contributions of the mission group members. For the work concerned by this article, we would like to thank Etienne Berthier (LEGOS), Jérémie Mouginot (IGE), Renaud Binet (CNES), Raphael Almar (LEGOS), Hervé Yesou (i-Cube), Arnaud Lucas (IPGP), Anne Puissant (Live), Jean-Philippe Malet (EOST), David Scheeren (Dynafor), Simon Gascoin (Cesbio).
References
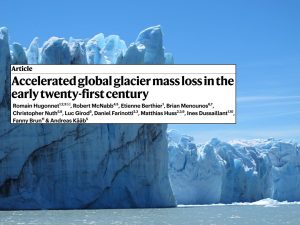
Romain Hugonnet, Robert McNabb, Etienne Berthier, Brian Menounos, Christopher Nuth, Luc Girod, Daniel Farinotti, Matthias Huss, Ines Dussaillant, Fanny Brun, et al. Accelerated global glacier mass loss in the early twenty-first century. Nature, 592(7856):726–731, 2021.
Ian Joughin, David E Shean, Benjamin E Smith, and Dana Floricioiu. A decade of variability on jakobshavn isbræ: ocean temperatures pace speed through influence on mélange rigidity. The cryosphere, 14(1):211–227, 2020.
Simon Rougier, Anne Puissant, André Stumpf, and Nicolas Lachiche. Comparison of sampling strategies for object-based classification of urban vegetation from very high resolution satellite images. International Journal of Applied Earth Observation and Geoinformation, 51:60–73, 2016.
David Morin, Milena Planells, Dominique Guyon, Ludovic Villard, Stéphane Mermoz, et al.. Estimation and mapping of forest structure parameters from open access satellite images: development of a generic method with a study case on coniferous plantation. Remote Sensing, MDPI, 2019, 11 (11), pp.1-25.
Erwin W.J. Bergsma, Rafael Almar, Amandine Rolland, Renaud Binet, Katherine L. Brodie, and A. Spicer Bak. Coastal morphology from space: A showcase of monitoring the topography-bathymetry continuum. Remote Sensing of Environment, 261:112469, 2021.