Spot the odd one out
 =>
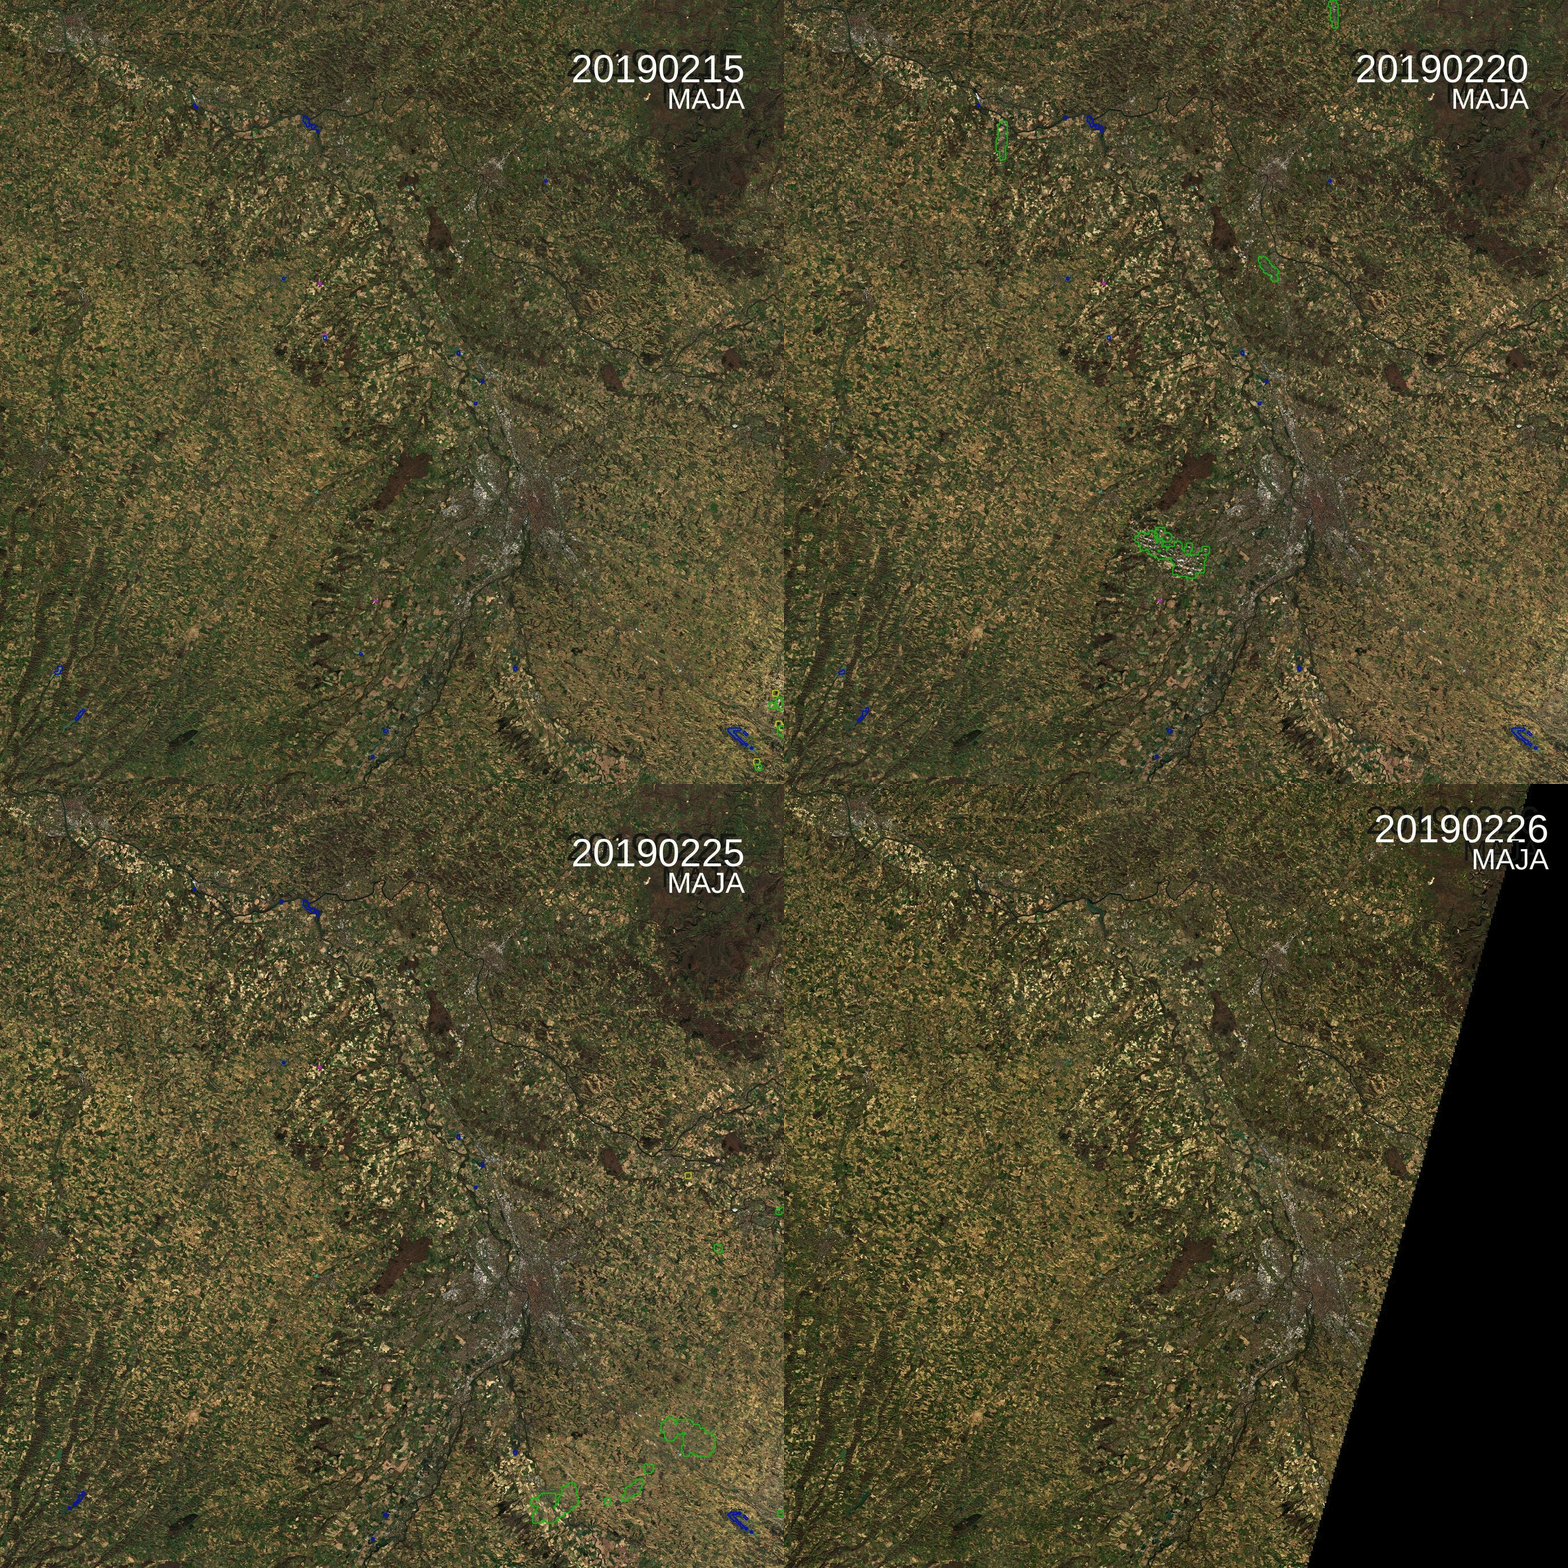
=>  There is an odd image in this time series of L2A products of the 31TCJ Sentinel-2 tile (Toulouse region). Can you guess which one ? Yes it is the last one, acquired on the 26th of February. But what’s odd with it ?
- The black South East corner ? No, just a different orbit
- The date ? Close enough…
- Two images separated by one day (25 th, 26 th of January) ? You’re boiling !
There was no Sentinel-2 image over Toulouse on the 26th, and the image comes from LANDSAT-8. Wait, LANDSAT-8 data on Sentinel tiles ? Yes, Theia is now producing Landsat-8 L2A data over France and its overseas territories with MAJA processor, and before that, the L1 products from USGS are reprojected and resampled on Sentinel-2’s grid of tiles. The formats of L2A products from LANDSAT-8 and Sentinel-2 are very similar, to help you easily use both data sets. As there is still a manual step in Theia’s LANDSAT-8 production, the products are not generated in near real time, but after a couple of weeks. The production started with the data acquired in March 2017. Before that, you will find « old format data », that we will reproduce as soon as we find some time to do it..
- Since March 2017, Landsat-8 data are accessible here
- Before Mars 2017, and actually since 2009, Landsat data are there
The Theia_download tool was adapted to allow you to download LANDSAT-8 data. As you can see on the image above, the time series is very homogeneous, and it is difficult to see a difference in tint, in should therefore be easy for you to integrate these images to your application.