Sensing wave patterns in sea ice with Sentinel-2

Collard et al. (2022) have shown that Sentinel-2 can be used to estimate the wave spectrum in the presence sea ice. The waves tilt the sea ice surface and therefore modulate the reflected radiation that is received by Sentinel-2 sensor. The wave spectrum extracted from the image can even be used to invert the wave height.

I selected a region in the Arctic ocean (78.85°N,49.68°E) captured on 23 March 2019 and stretched the contrast of band 04 surface reflectance. The wavy signal is clearly visible.

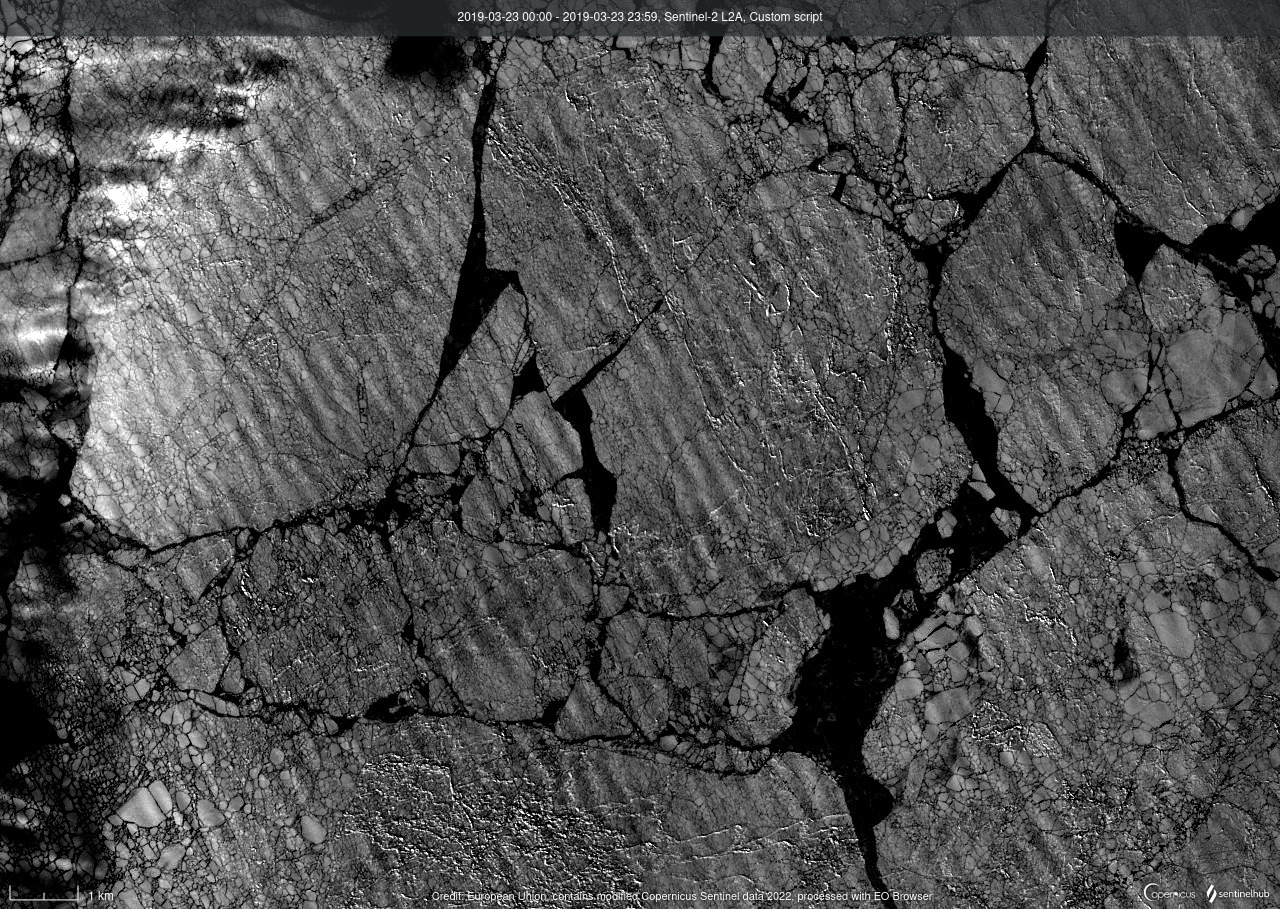
But there is more: the authors also mention that 1 second delay between the acquisition of the band 02 and band 04 can be used to remove « the 180° ambiguity on wave propagation ».

Indeed if we compare B04 and B02 we can see that the undulation patterns changes between both acquisitions.

Band 02 and band 04 (78.79°N, 50.12°E 23 March 2019 as in Fig. 7 of Collard et al. 2022)


Collard, F., Marié, L., Nouguier, F., Kleinherenbrink, M., Ehlers, F., & Ardhuin, F. (2022). Wind-wave attenuation in Arctic sea ice: A discussion of remote sensing capabilities. Journal of Geophysical Research: Oceans, 127, e2022JC018654, https://doi.org/10.1029/2022JC018654

Plus d'actualités

BIOMASS, the third launched satellite mission designed at CESBIO !

After SMOS in 2009, and VENµS in 2017, the CESBIO Laboratory is very proud to see its third proposed mission, Biomass, reach orbit. As always, it has been a long journey from the idea, at the beginning of the century, to the selection in 2013 as the seventh Earth Explorer Mission by ESA, to the […]

Sentinel-2 reveals the surface deformation after the 2025 Myanmar earthquake

Sentinel-2 captured several clear-sky images of Myanmar before and after the 28 March 2025 earthquake. The animation below shows a 5-day apart sequence of images captured by Sentinel-2B and Sentinel-2C (10 m resolution) near the epicenter located close to Mandalay. The surface slip due to the earthquake follows the Sagaing Fault, a major fault in […]

Evolution de l’altitude de la ligne de neige au cours des 41 dernières années dans le bassin versant du Vénéon (Oisans)

Pour contribuer à caractériser les conditions hydrométéorologiques lors de la crue torrentielle qui a frappé la Bérarde en juin, j’ai analysé une nouvelle série de cartes d’enneigement qui couvre la période 1984-2024 [1]. Grâce à la profondeur temporelle de cette série, on constate que l’altitude de la ligne de neige dans le bassin versant du […]

Rechercher