
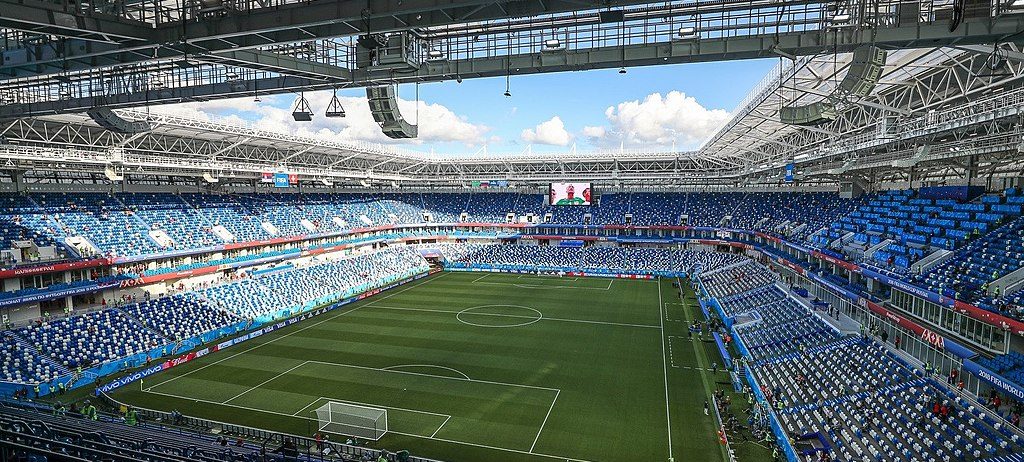
NDVI time series in 2018 World Cup stadiums

The figure below shows the evolution of the Normalized Difference Vegetation Index (NDVI) in the pitches of all the 2018 World Cup stadiums.
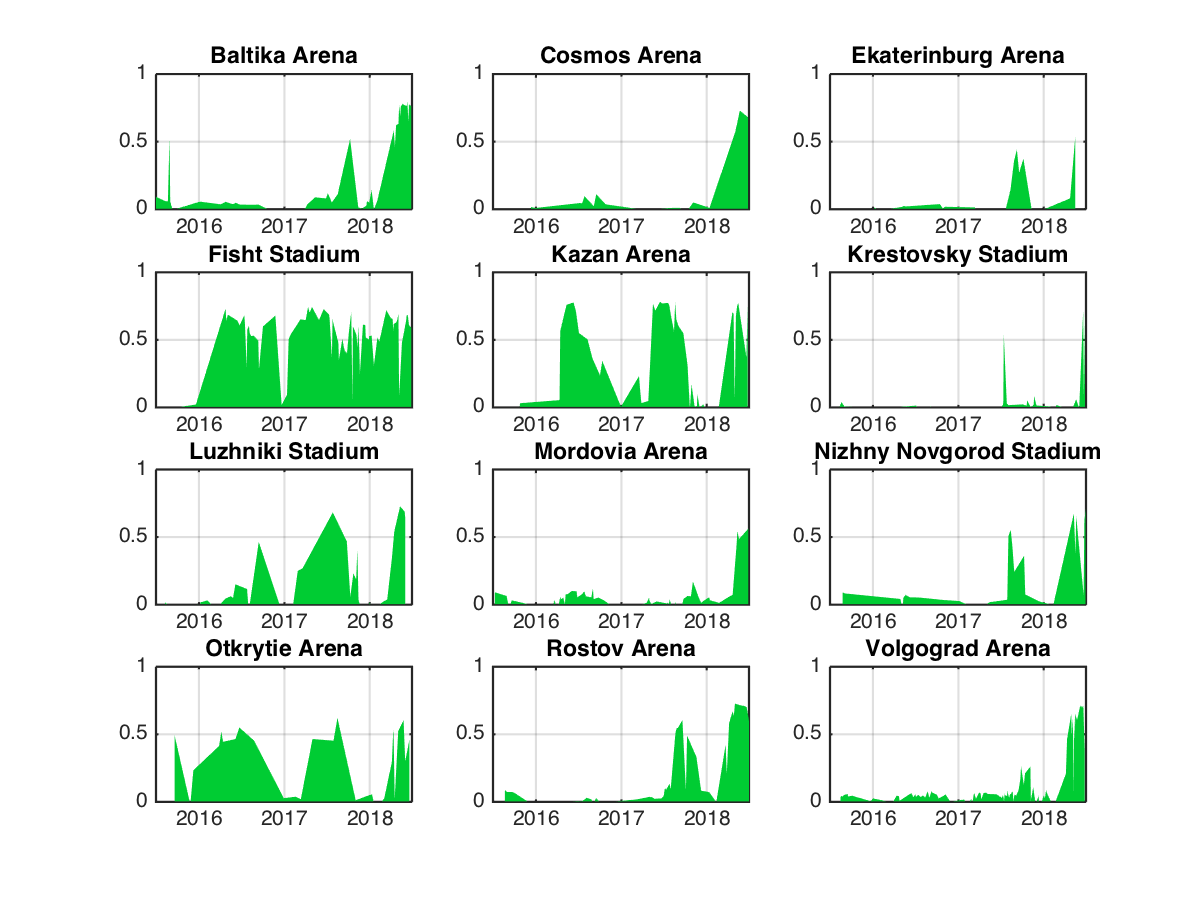
NDVI in the piches of the 2018 FIFA World Cup stadiums. Data from Copernicus Sentinel-2.
NDVI in the 2018 FIFA World Cup stadiums

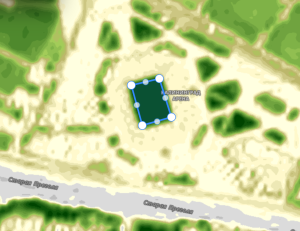
I retrieved these data from Sentinel-2 observations using the new time series plotter in the EO Browser. I just drew a polygon in each of the 12 stadiums to get the average NDVI values on every available cloud-free date.
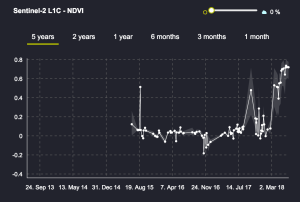
 

Because the NDVI is a proxy of the vegetation health (here the grass on the pitch), these charts allow us to identify which stadiums were built for the 2018 World Cup (Volgograd Arena, Cosmos Arena). On the other hand, the Fisht stadium in Sotchi looks well maintained since 2016. It « served as the venue for the opening and closing ceremonies of the 2014 Winter Olympics (…) was originally built as an enclosed facility; it was re-opened in 2016 » (wikipedia). Also it should be noted that the Krestovsky Stadium in Saint Petersburg is a retractable roof stadium. « As of May 2017, the stadium was 518% late and 548% over budget (…) At a cost of $1.1 billion at current exchange rates, it is considered one of the most expensive stadiums ever built. » (wikipedia).

Hopefully the grass will remain green in the next months, unlike some stadiums in Brazil after the Olympics.  In the meantime, as you can see by yourself, the grass is blue in the Kazan Arena!
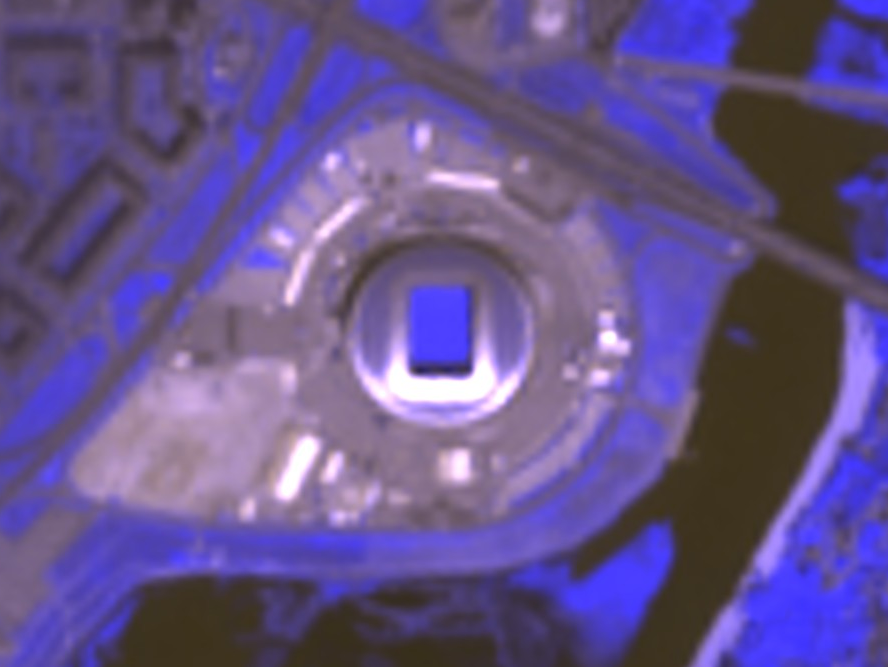
Color composite of the Kazan Arena on June 27, three days before the first encounters of the Round of 16 (France vs. Argentina)

Plus d'actualités

How long is the cooling effect of a cloud shadow ?

How long does it take for the cannon barrel to cool down after firing a shell ? Fernand Raynaud => This quote is from a famous old French funny sketch by Fernand Raynaud, which was based on a question in a French manual for soldiers: the sketch is rather long, so I’ll give you the […]

Impact of the August 12, 2026 eclipse on photovoltaic electricity generation in Spain

Photovoltaic (PV) energy supplies more 20% of Spain’s total electricity, and this share hit a new high in July 2026 (28.3% of the nation’s monthly electricity mix). Some media outlets were concerned about the drop in photovoltaic power generation during the 12-Aug-2026 eclipse. Le Monde explained that « the drop is expected to be particularly pronounced […]

Near real time snow cover maps in the Copernicus Browser!

Copernicus provides near real time snow cover maps at 20 m resolution (fractional snow cover, code name: FSC OG). These products have been recently reprocessed and are now available through the Copernicus Data Space Ecosystem (CDSE) API and visualization tool, the Copernicus Browser! The latter is very useful to explore the data, for example if […]

Rechercher
