How does revisit affect data fusion methods (between S2 and a potential VHR constellation)
In a previous post, we showed that spatio-temporal fusion methods would enable to obtain hybrid data with the revisit of the S2-NG mission (3 to 5 days), and the resolution of the Sentinel-HR mission (2 m), with an uncertainty better than the atmospheric correction errors (better than 0.01 in reflectance). In this section, we tested how this uncertainty evolves if we change the revisit of the Sentinel-HR constellation. The analysis was done by Julien Michel and Ekaterina Kalinicheva at CESBIO, and was partially funded by ESA in the framework of S2-NG preparation, by CNES, and by the EVOLAND (Horizon Europe) project.
Data Sets
As explained in the previous post, the work is based on VENµS and Sentinel-2 time series, with VENµS simulating the VHR mission, and S2 the S2-NG mission. To keep a factor 2.5 between the resolution of S2-NG and VENµS, we had to degrade S2 resolution to 12.5 m, as VENµS has a resolution of 5 m. VENµS images can be acquired with a 2 day revisit, but the acquisitions from this microsatellite have not always been fully reliable: there have been periods when the satellite was devoted to another mission, a few temporary breakdowns, and also recurrent downlink issues. As a result, it is not straightforward to simulate a regular time series with 10, 20, 30 and 60 days revisit for instance.
The study has been applied to 5 VENµS time series on different sites displayed in the table below, and an image of each region is provided.
| VENµS site name | Country | description |
| ARM | USA | Intensive agriculture |
| ESGISB | France | Forests, small urban fabric |
| ES-IC3XG | SPAIN | Forest Herbaceous vegetation |
| FR-LAM | France | Agriculture, some woods |
| MAD-AMBO | Madagascar | Arid, Shrubs |
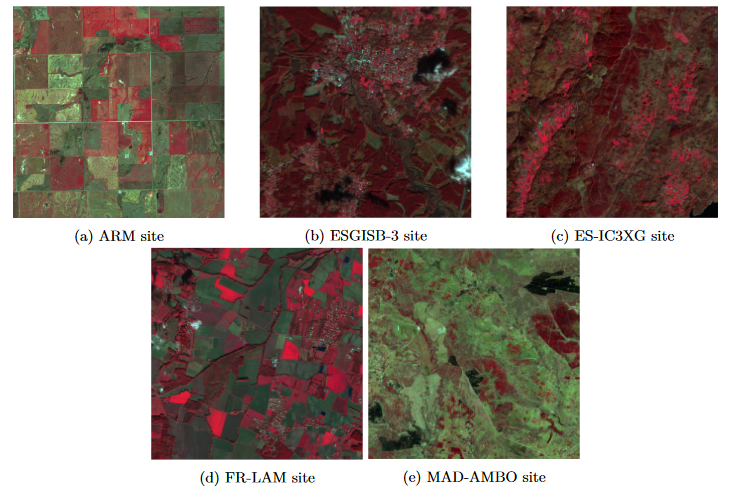
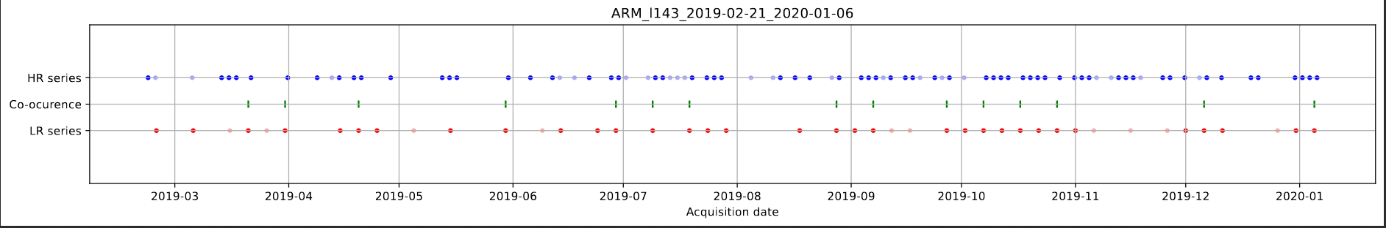
The following graph provides a representation of the dates for the ARM site :
In order to simulate the desired VHR series revisit, the following process is applied.
- all the dates with more than 50% cloud coverage are discarded
- S2 and VENµS acquisitions on the same day are searched to be used as a validation data set. In order to have an independent evaluation, same day acquisitions are therefore removed from the HR series and kept apart to serve as reference images in the evaluation process.
The remaining HR dates are processed as follows:
- A grid of dates with target revisit, starting at the first available HR date, is defined
- For each position in the grid, the closest HR date is selected. If this date was acquired less than N days apart from the grid date, the date is kept, otherwise it is discarded. We used N=¼ of the Target HR revisit.
| Target revisit with less than 50 % of clouds | Number of dates | Mean revisit | Minimum revisit | Maximum revisit | Rough value of revisit of a real satellite mision allowing the target revisit |
| 10 | 20 | 16.4 | 6 | 32 | 8 |
| 20 | 14 | 23 | 16 | 38 | 12 |
| 30 | 11 | 30 | 24 | 36 | 15 |
| 40 | 8 | 39.7 | 34 | 46 | 20 |
| 50 | 7 | 50 | 48 | 53 | 25 |
| 60 | 6 | 60 | 56 | 64 | 30 |
Because of the gaps in VENµS acquisitions and because we removed the simultaneous images to get reference results, we could not simulate a real and regular revisit over long period of times. As explained above we worked with ‘target HR revisits with less than 50% of cloud cover. The mean revisit is the most interesting column, as it takes into account the missing dates, the reference dates, and the cloud coverage. For the high values, we have a mean revisit close to the target one, but for the low values, the mean revisit is higher.
Knowing that on average, 70 % of pixels are cloudy on the earth, we estimate that half of the acquisitions in a regular revisit provide images with less than 50% of clouds. We acknowledge that this should be checked. With this rule of thumb, we decided to test 3 configurations that correspond to 20, 40 and 60 days revisit with 50% cloud free, and therefore should correspond respectively to more or less to 12, 20 and 30 days revisit of a VHR constellation. We would have liked to test longer periods, but the number of dates used would be really reduced and the results could be statistically insignificant.
Methods
To the 5 methods presented in the previous section, we removed the single image super resolution CARN, as it is not sensitive to the revisit (the VHR data are only used to train the network). Two new methods were added, named “Data Mining Sharpener”, and “Data fusion”.
- DMS : Data Mining Sharpener[1], has been widely use to improve the resolution of TIR images. It makes a regression between HR and LR data, and requires to make a new learning at each image. It needs a new learning for each image.
- DF (Data fusion), uses the Extended Super-Resolution Convolutional Neural Network[2], based on the architecture of Single Image Super resolution network named SCRNN. It has a simple architecture with 3 convolution layers, uses N HR images as input, and needs a new training for each image.
The zoom method does not need VHR data, and the gap-filling does not use S2-NG data. The four other methods (StarFM, DMS, DF and DDI ) used 2 dates before and 2 dates after the reference date. For a target revisit of 30 days (60 days with less than 50% of clouds), the VHR acquisition span over 180 days (three intervals of about 60 days), or half a year !
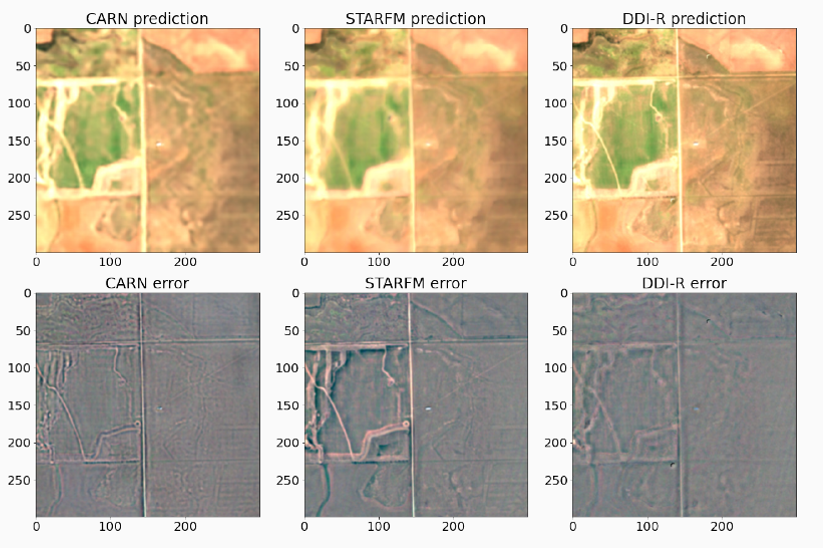
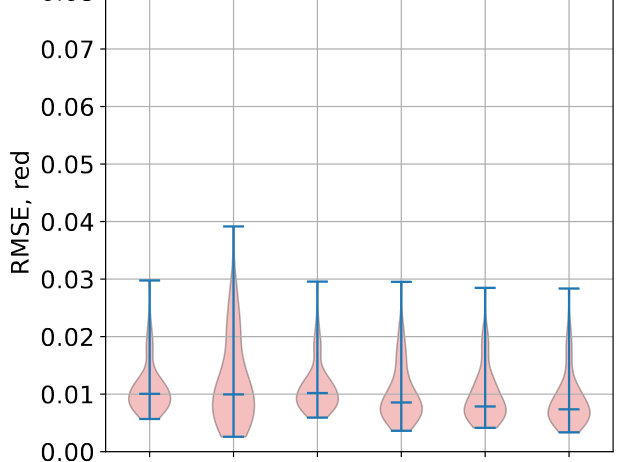
Results
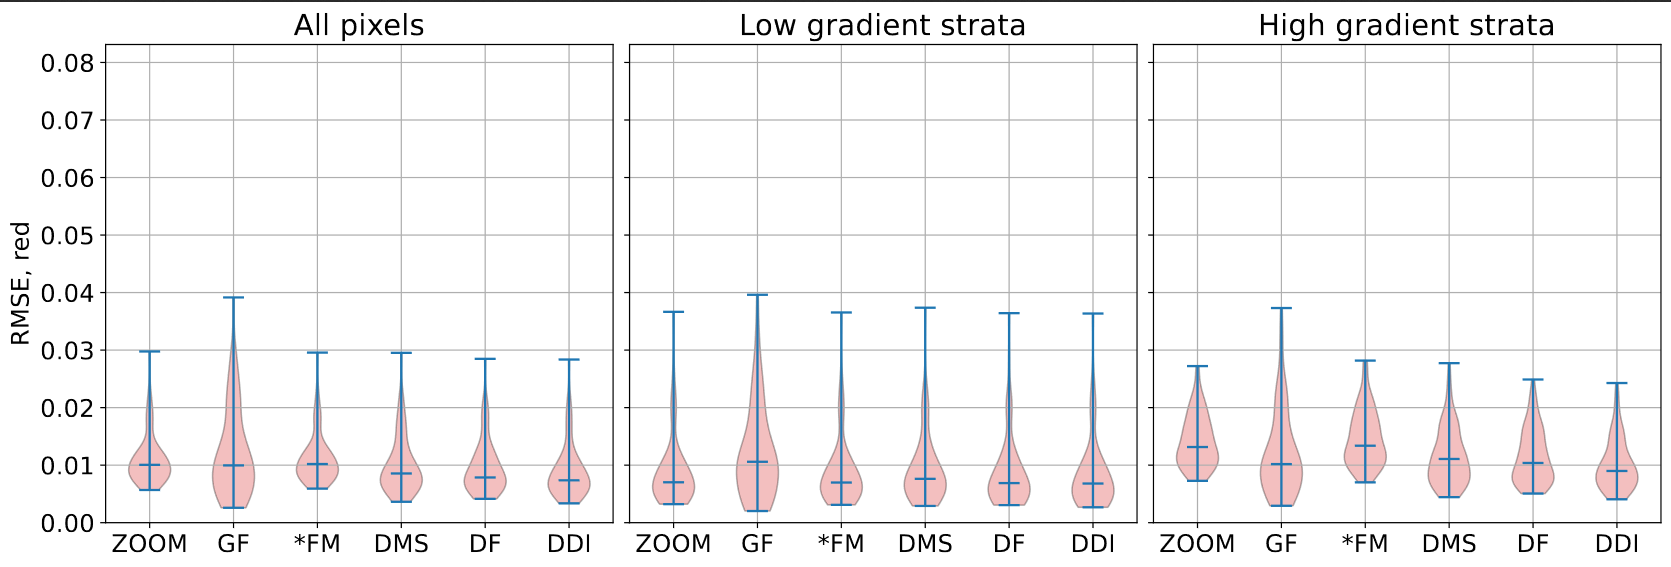
The graphs below show that the DDI method has better performances than the other methods, that the Gap filling (or linear interpolation against time), which does not use the more frequent S2-NG images, can sometimes have very good performances when the VHR images are frequent, or when the landscape does not change much. However, of course, when changes occur, the performances are degraded, and an increased degradation is observed with the revisit. The three data fusion methods (DMS, DF, DDI) seem to behave almost equally, with DDI marginally better. We only show the red band here, but the results for the other VHR bands are similar.
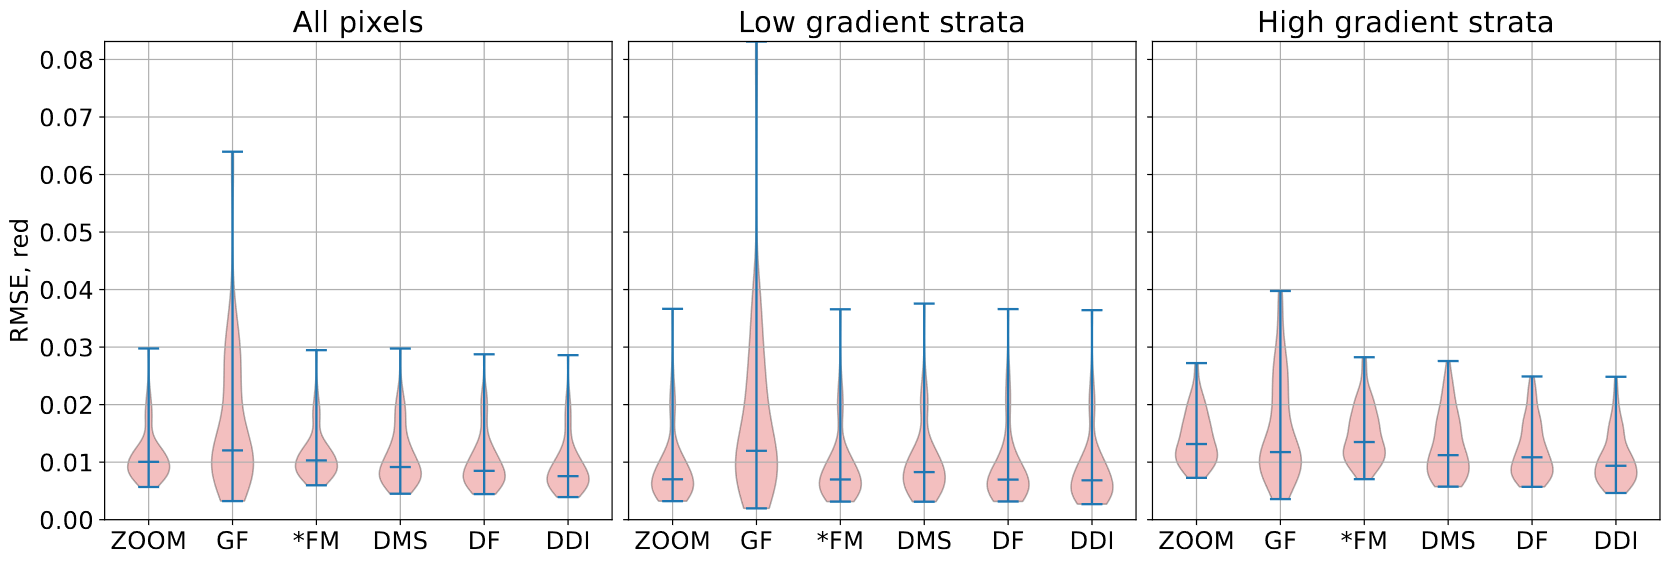
Another experiment was done simulating the S2-NG images from VENµS ones, before applying the fusion methods to the simulated images (next figure). This avoids all the differences between S2 and VENµS regarding spectral bands, viewing directions, registration errors and noise… The figure below shows that the performance of (DMS, DF and DDI) are much better, and that DDI gives the best results. It is also interesting to know that most of the residual errors in the figures above are due to differences between VENµS and S2 and not to the data fusion. However, we think that the performances obtained using VHR data simulated by VENµS and LR simulated from S2 correspond better to the real performances, than similar results with both VHR and LR simulated from VENµS. The degradation of performances due to using two different sensors is maybe a little exagerated because of the the larger viewing angles of VENµS, while the VHR constellation should be observing at NADIR.
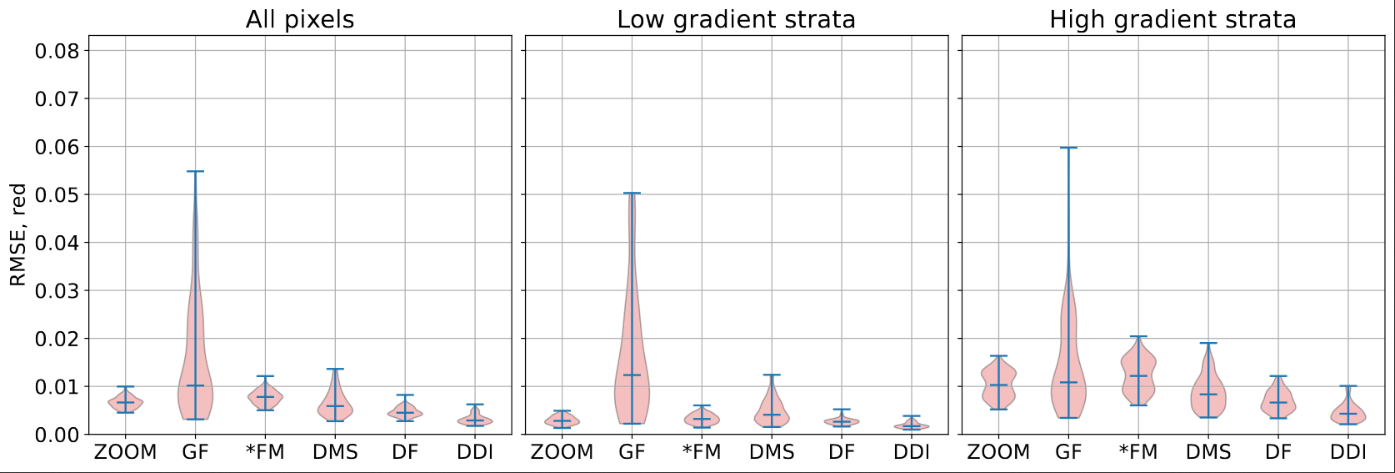
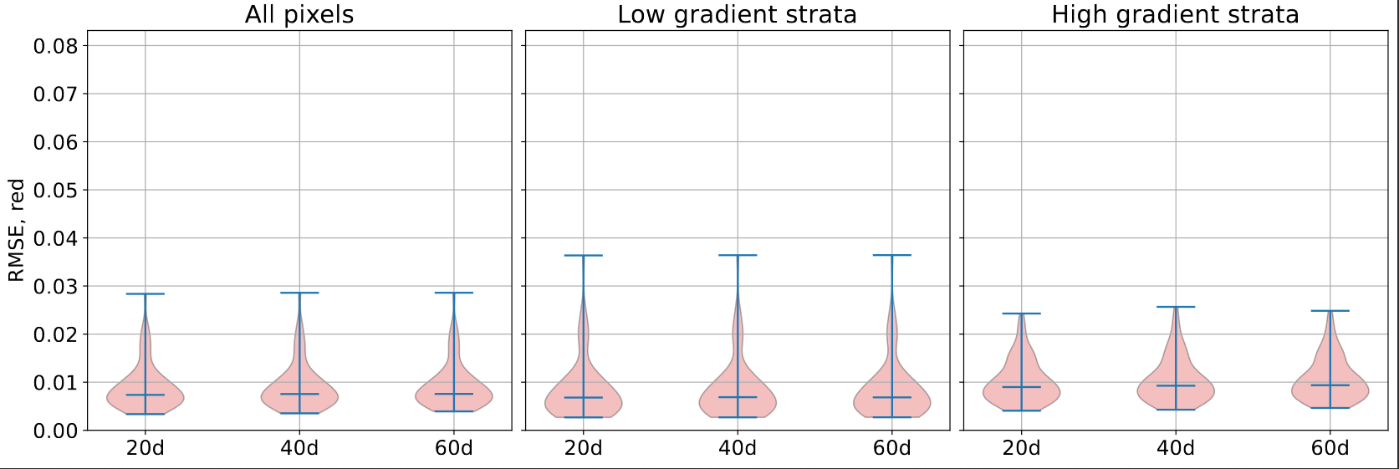
The following figure compares the DDI method performances as a function of the revisit (with less than 50% cloud cover). Contrarily to the Gap filling, the degradation with time exists but is very low, showing that 30 days revisit (or 60 days with less than 50 of clouds) could be acceptable.
Conclusion
As a conclusion, it appears that the fusion methods are quite robust to the degradation of the VHR revisit. The high resolution feature seem to be quite stable with time, and that the evolutions only concern a small fraction of the pixels. With such results, a revisit of 30 days could seem acceptable. However, such a diagnostic should be tempered by the fact that even if they don’t happen frequently, quick changes of VHR details are an important part of what is searched in such missions. Fusion methods may provide unreliable results when for instance a catastrophic event occurs which is not observed by the VHR imagery because of an infrequent revisit.
[1] Feng Gao, William P. Kustas, and Martha C. Anderson. A data mining approach for sharpening thermal satellite imagery over land. Remote Sensing, 4(11):3287–3319, 2012.
[2] Zhenfeng Shao, Jiajun Cai, Peng Fu, Leiqiu Hu, and Tao Liu. Deep learning-based fusion of landsat-8 and sentinel-2 images for a harmonized surface reflectance product. Remote Sensing of Environment, 235(nil):111425, 2019.