First validation results with the Lamasquère ROSAS instrument
 =>
=>
Following its installation in March 2021, our new ROSAS device at Lamasquère has produced a first series of acquisitions over a complete maize crop cycle. The ROSAS system is based on the use of a multi-spectral photometer to carry out angular and spectral measurements of both incident and reflected radiation from the surface. The entire measurement sequence, which lasts 140 minutes, is then pre-processed to produce a bi-directional reflectance (BRDF) of the surface of the measurement site. It is then possible to calculate the spectral reflectances of a given instrument for observation conditions corresponding to the illumination and viewing angles of a remote sensing product, and thus to validate the Sentinel-2 surface reflectances calculated by an atmospheric effects correction processor such as Maja.
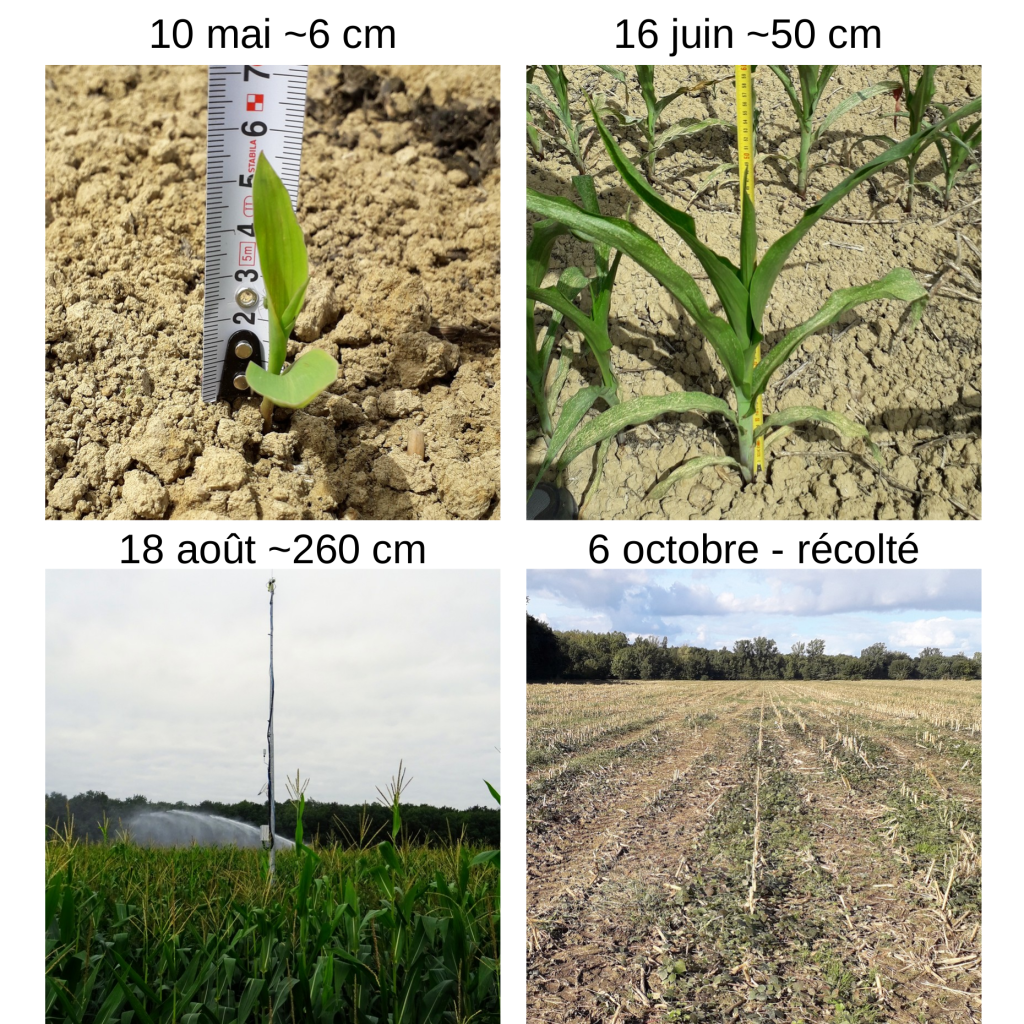
The system was installed during an intermediate crop cycle. A forage maize was then sown on the plot in mid-April, and harvested for silage in early October. The photometer therefore followed the entire growth cycle of the maize, from germination to maximum growth (~ 2.60m around the mast).
In spite of a stronger cloud cover than at the ROSAS site in La Crau (south of Arles), and even more so than at Gobabeb (Namibian site), the photometer performed enough complete cycles to follow the evolution of the surface state.
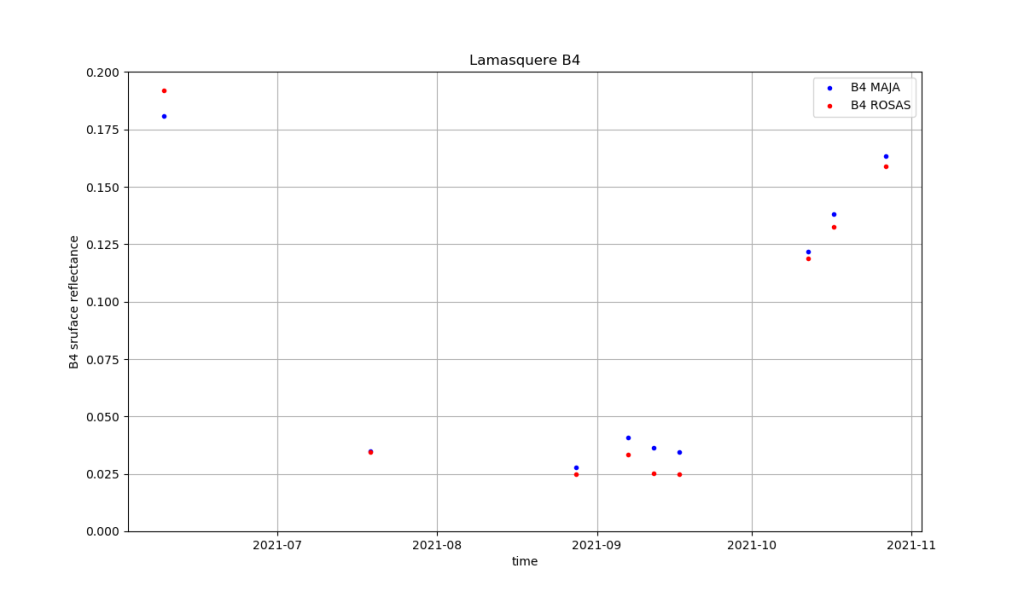
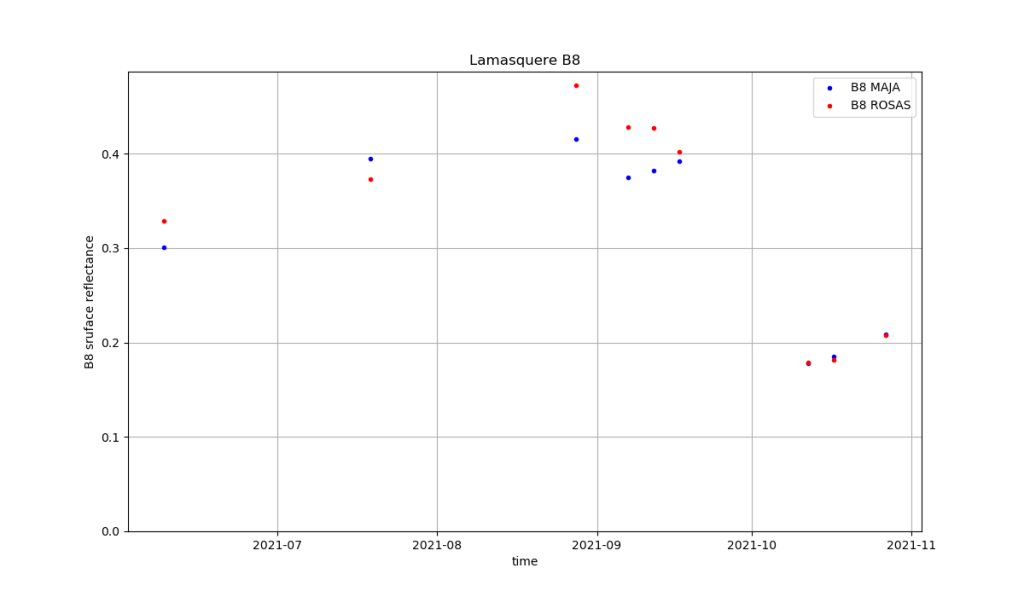
The evolution of the Sentinel-2 surface reflectances produced by MAJA fits pretty well with the ROSAS acquisitions. Although the sample size is small (9 observations after the acquisition quality filter), it is nevertheless possible to calculate the root mean square error (RMSE) per Sentinel-2 band as well as for the estimation of the optical thickness of the atmosphere (AOT). The results are presented in the table below.
| RMSE (S2A et S2B) | |
|---|---|
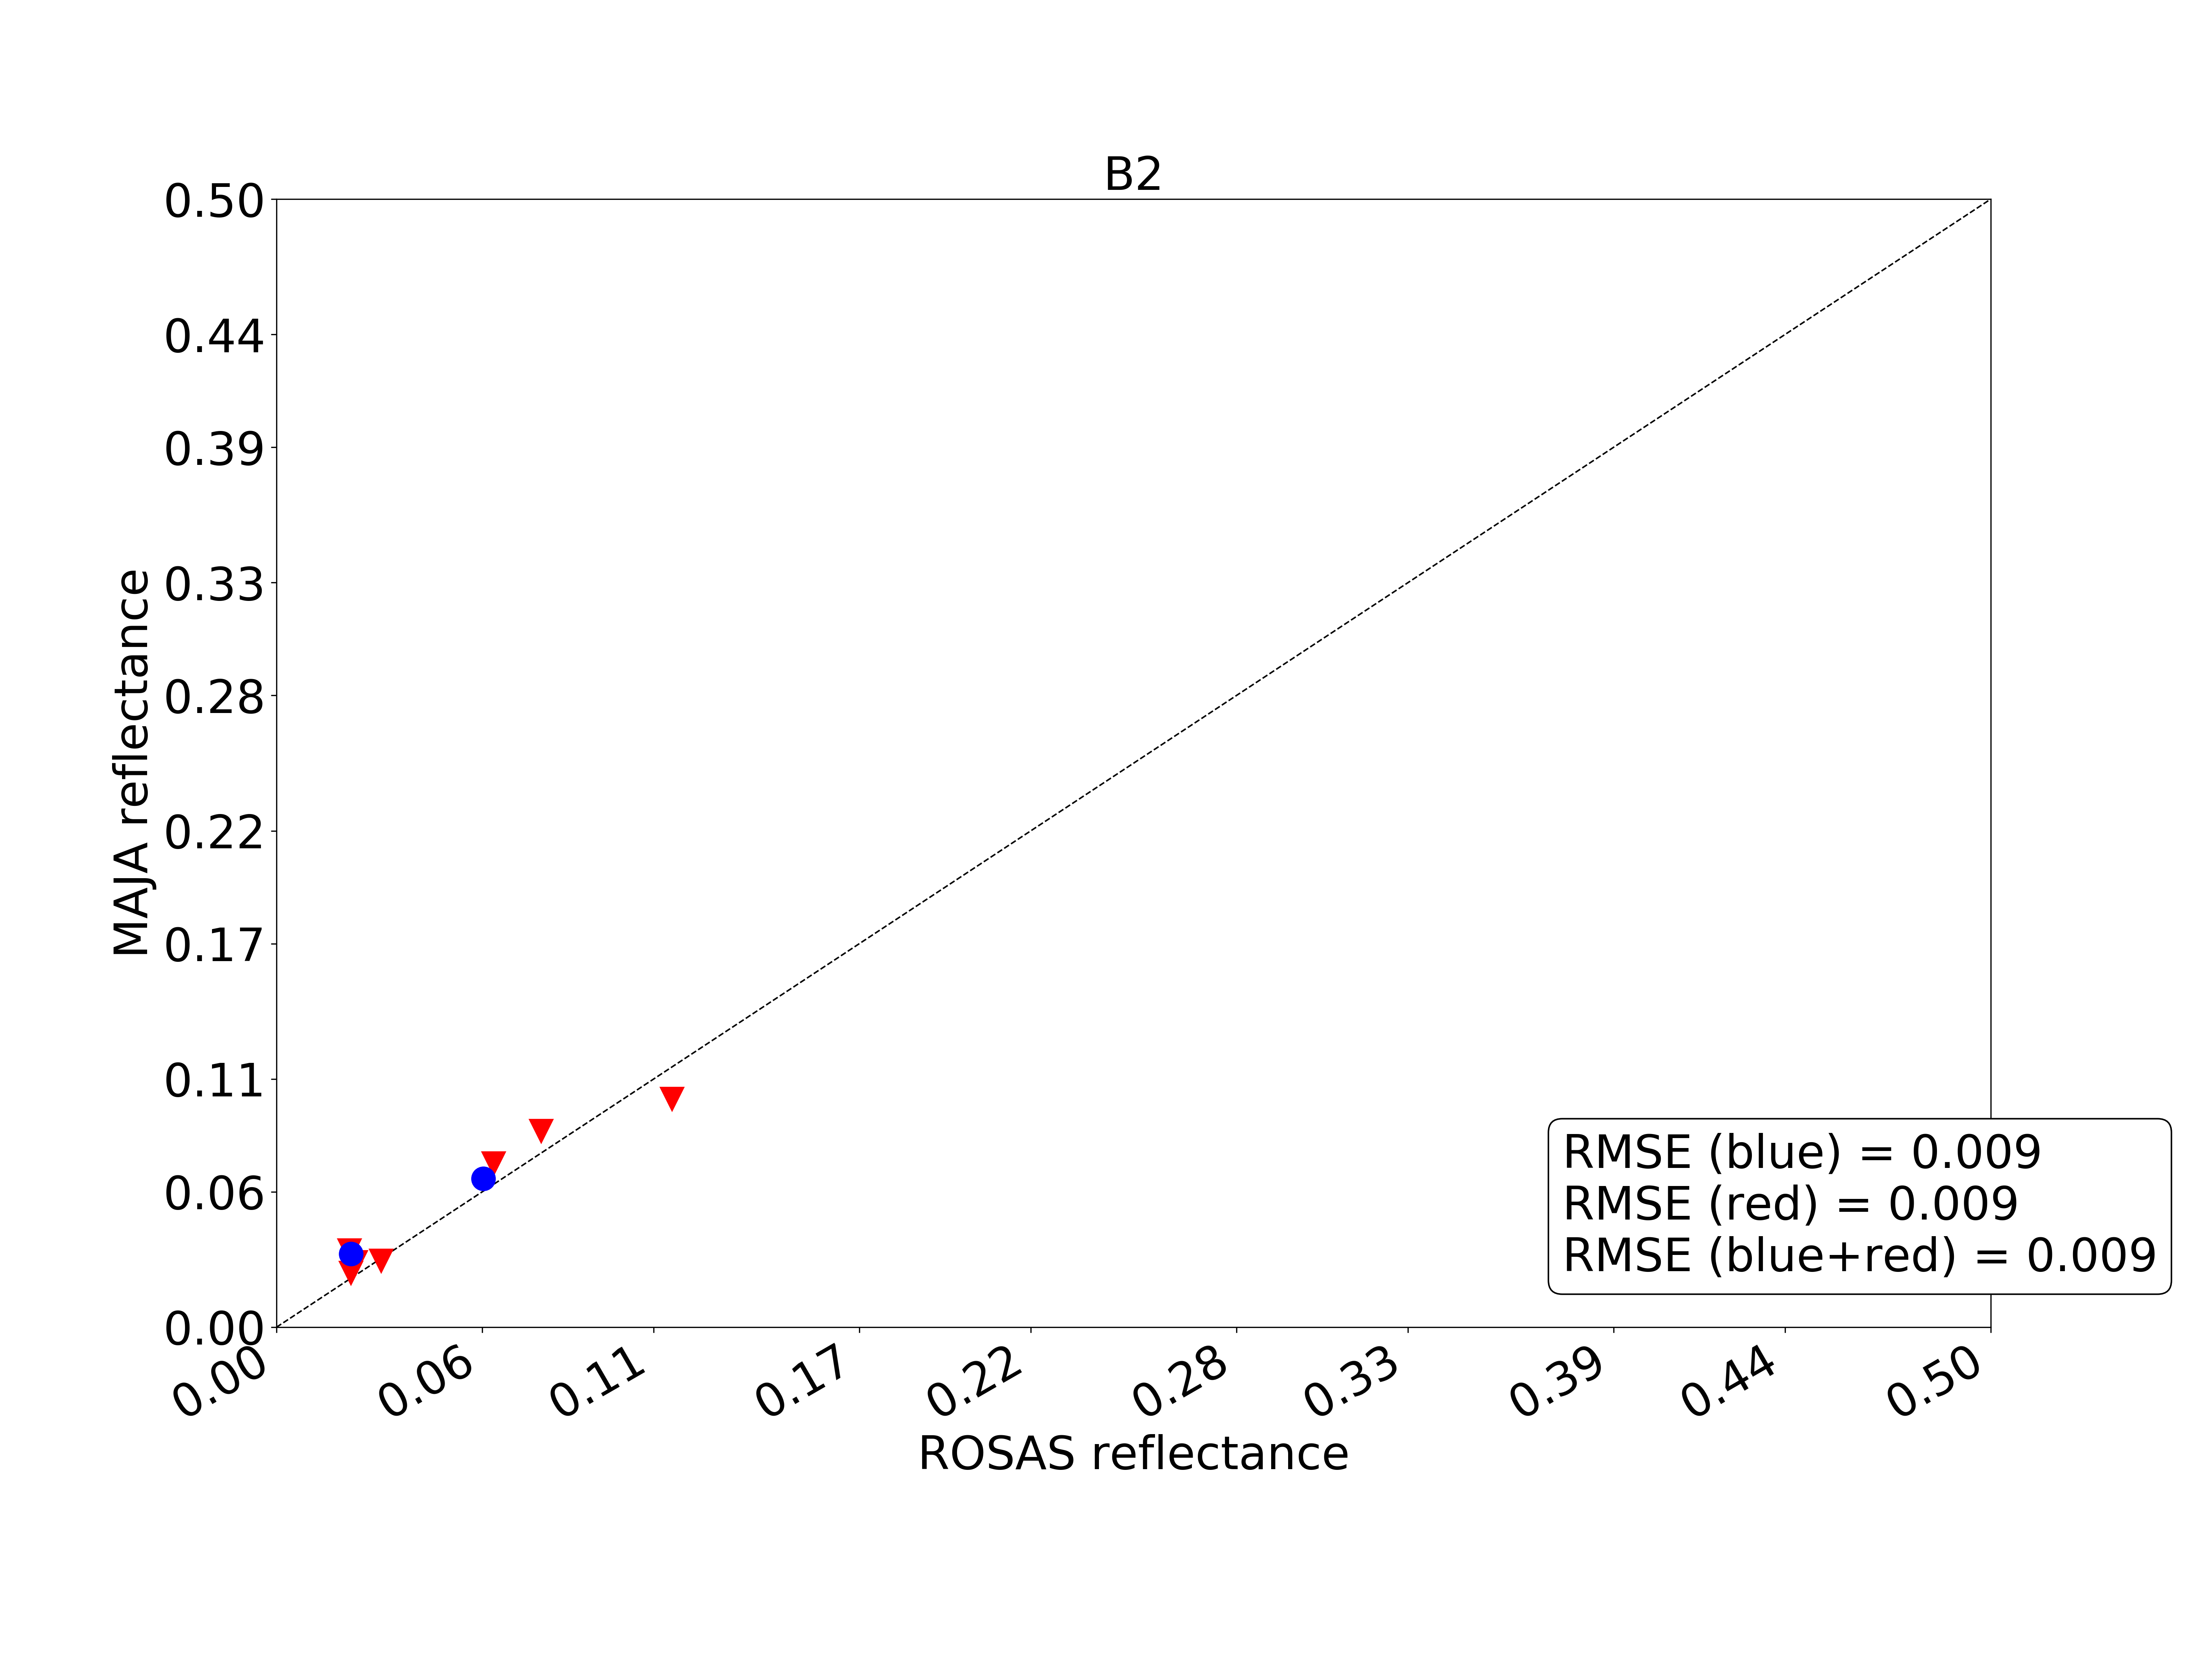
| B2 (490nm) | 0.009 |
| B3 (560nm) | 0.009 |
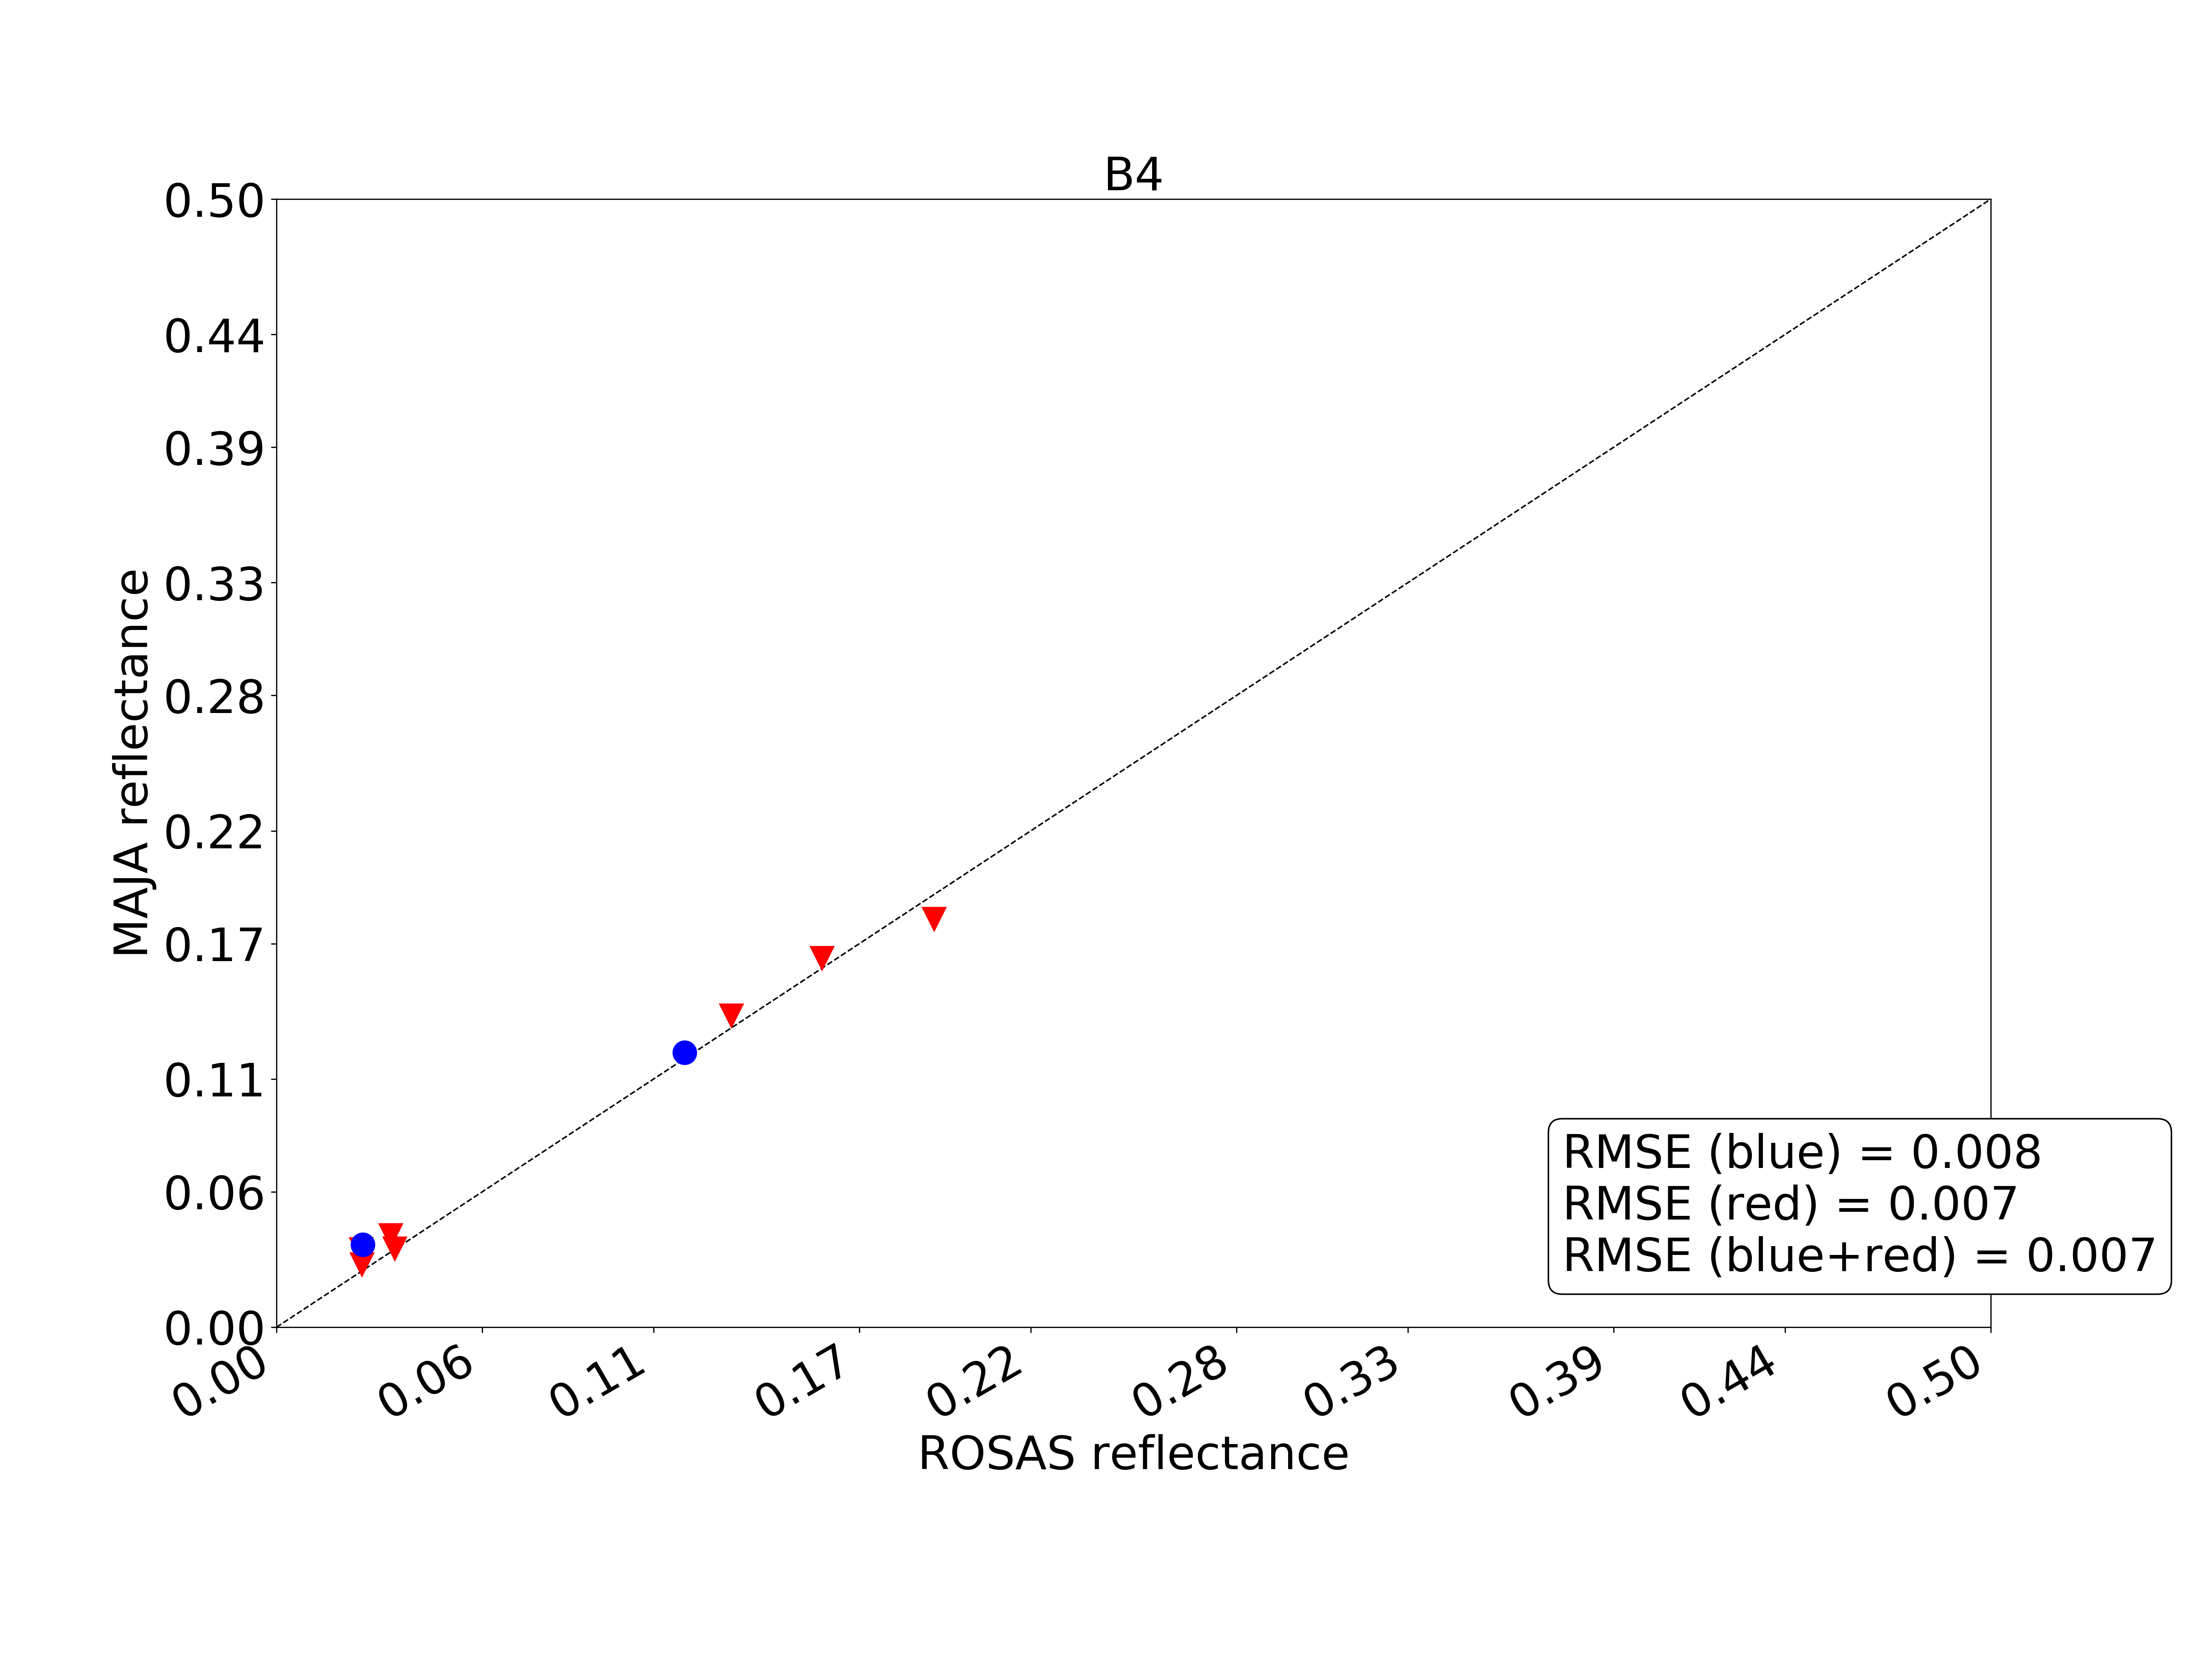
| B4 (665nm) | 0.007 |
| B5 (705nm) | 0.012 |
| B6 (740nm) | 0.024 |
| B7 (783nm) | 0.026 |
| B8A (865nm) | 0.030 |
| B8 (842nm) | 0.033 |
| B11 (1610nm) | 0.028 |
| AOT (-) | 0.068 |
While the RMSEs are very satisfactory for bands B2 to B4 (an RMSE of 1% is targeted for the estimation of surface reflectances), there is a quite some loss in the quality of estimates from B6 to B11. The differences are particularly significant in the near infrared for reflectances greater than 0.2. As atmospheric correction errors are usually greater in the blue than in the near infra-red, these errors could be due to stronger spatial heterogeneity in the PIR than in the visible, or to a BRDF that is not well reproduced by our model or by adjacency effects, or maybe to the effects of irrigation that can change the ground reflectance during the day (it takes one full day to obtain the full BRDF from ROSAS). This still needs further investigation. Winter wheat, sown at the end of October, will give us the opportunity to continue the exercise, this time on a lower and denser (and, we hope, more homogeneous) crop cover, which will provide us with additional data to refine our analysis.
To be continued…Many thanks to the CNES team in charge of processing the ROSAS datasets (Lucas Landier, Sophie Coustance and Nicolas Guilleminot) !
 |  |
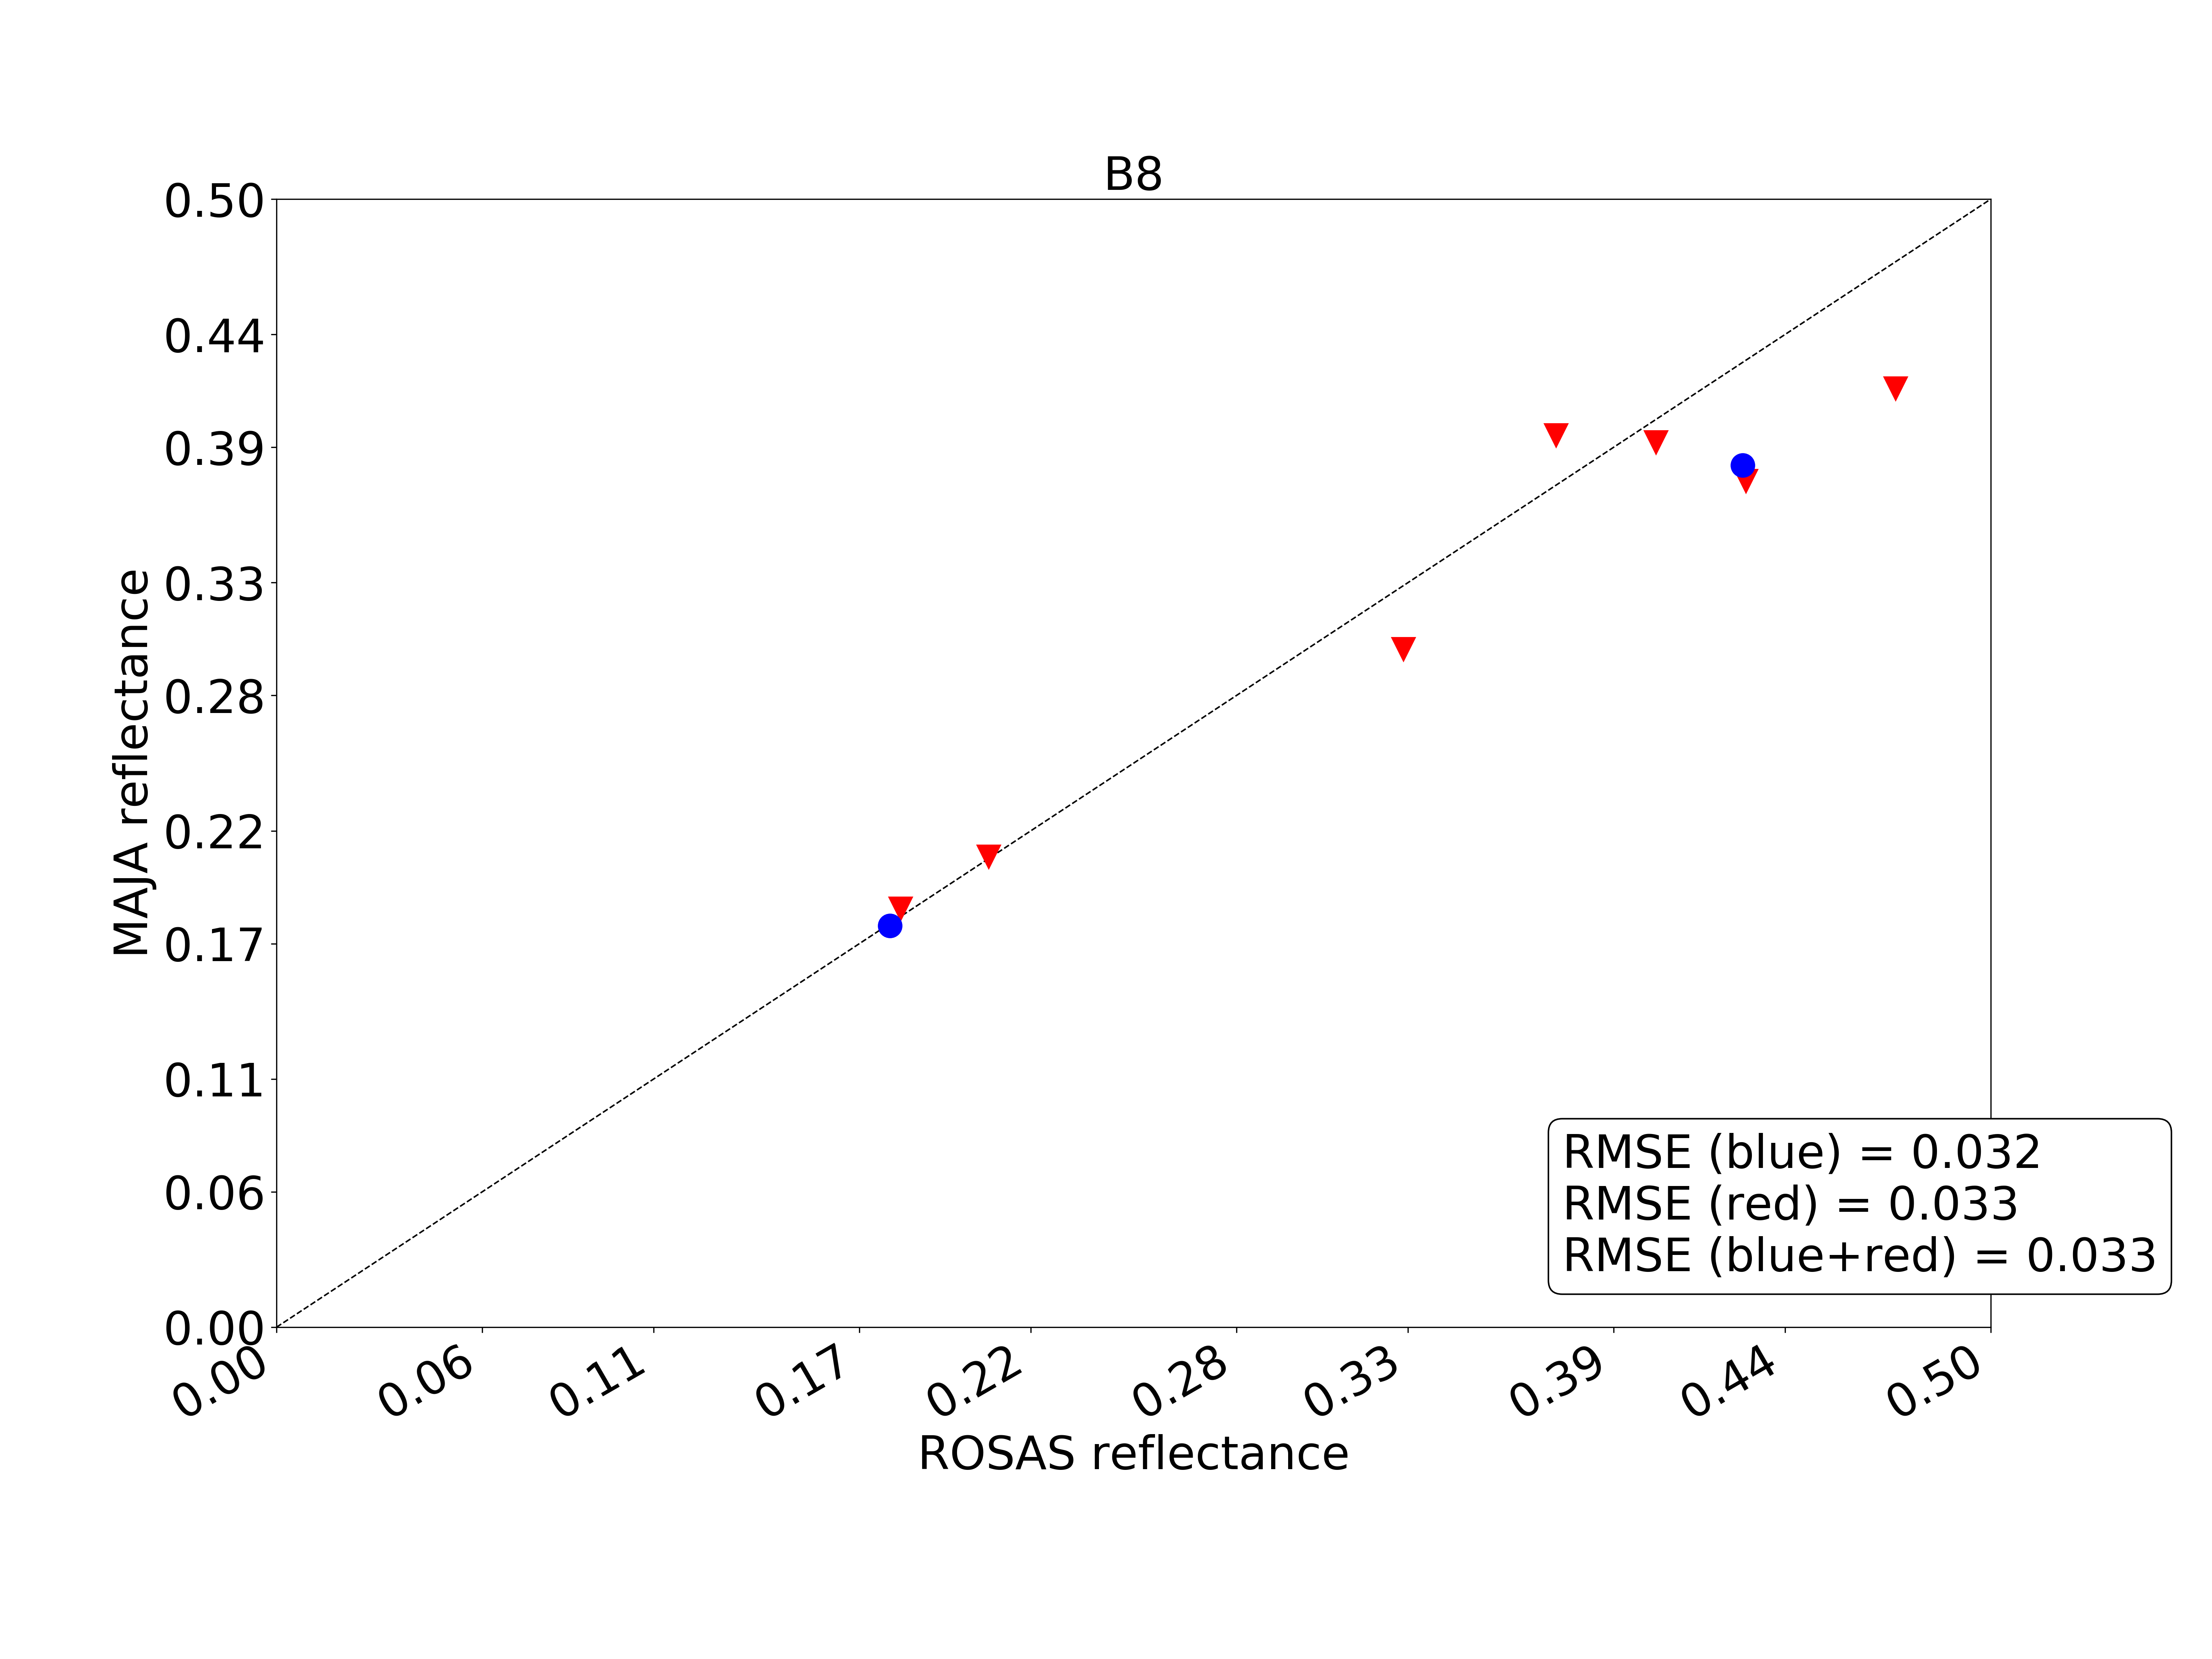 | 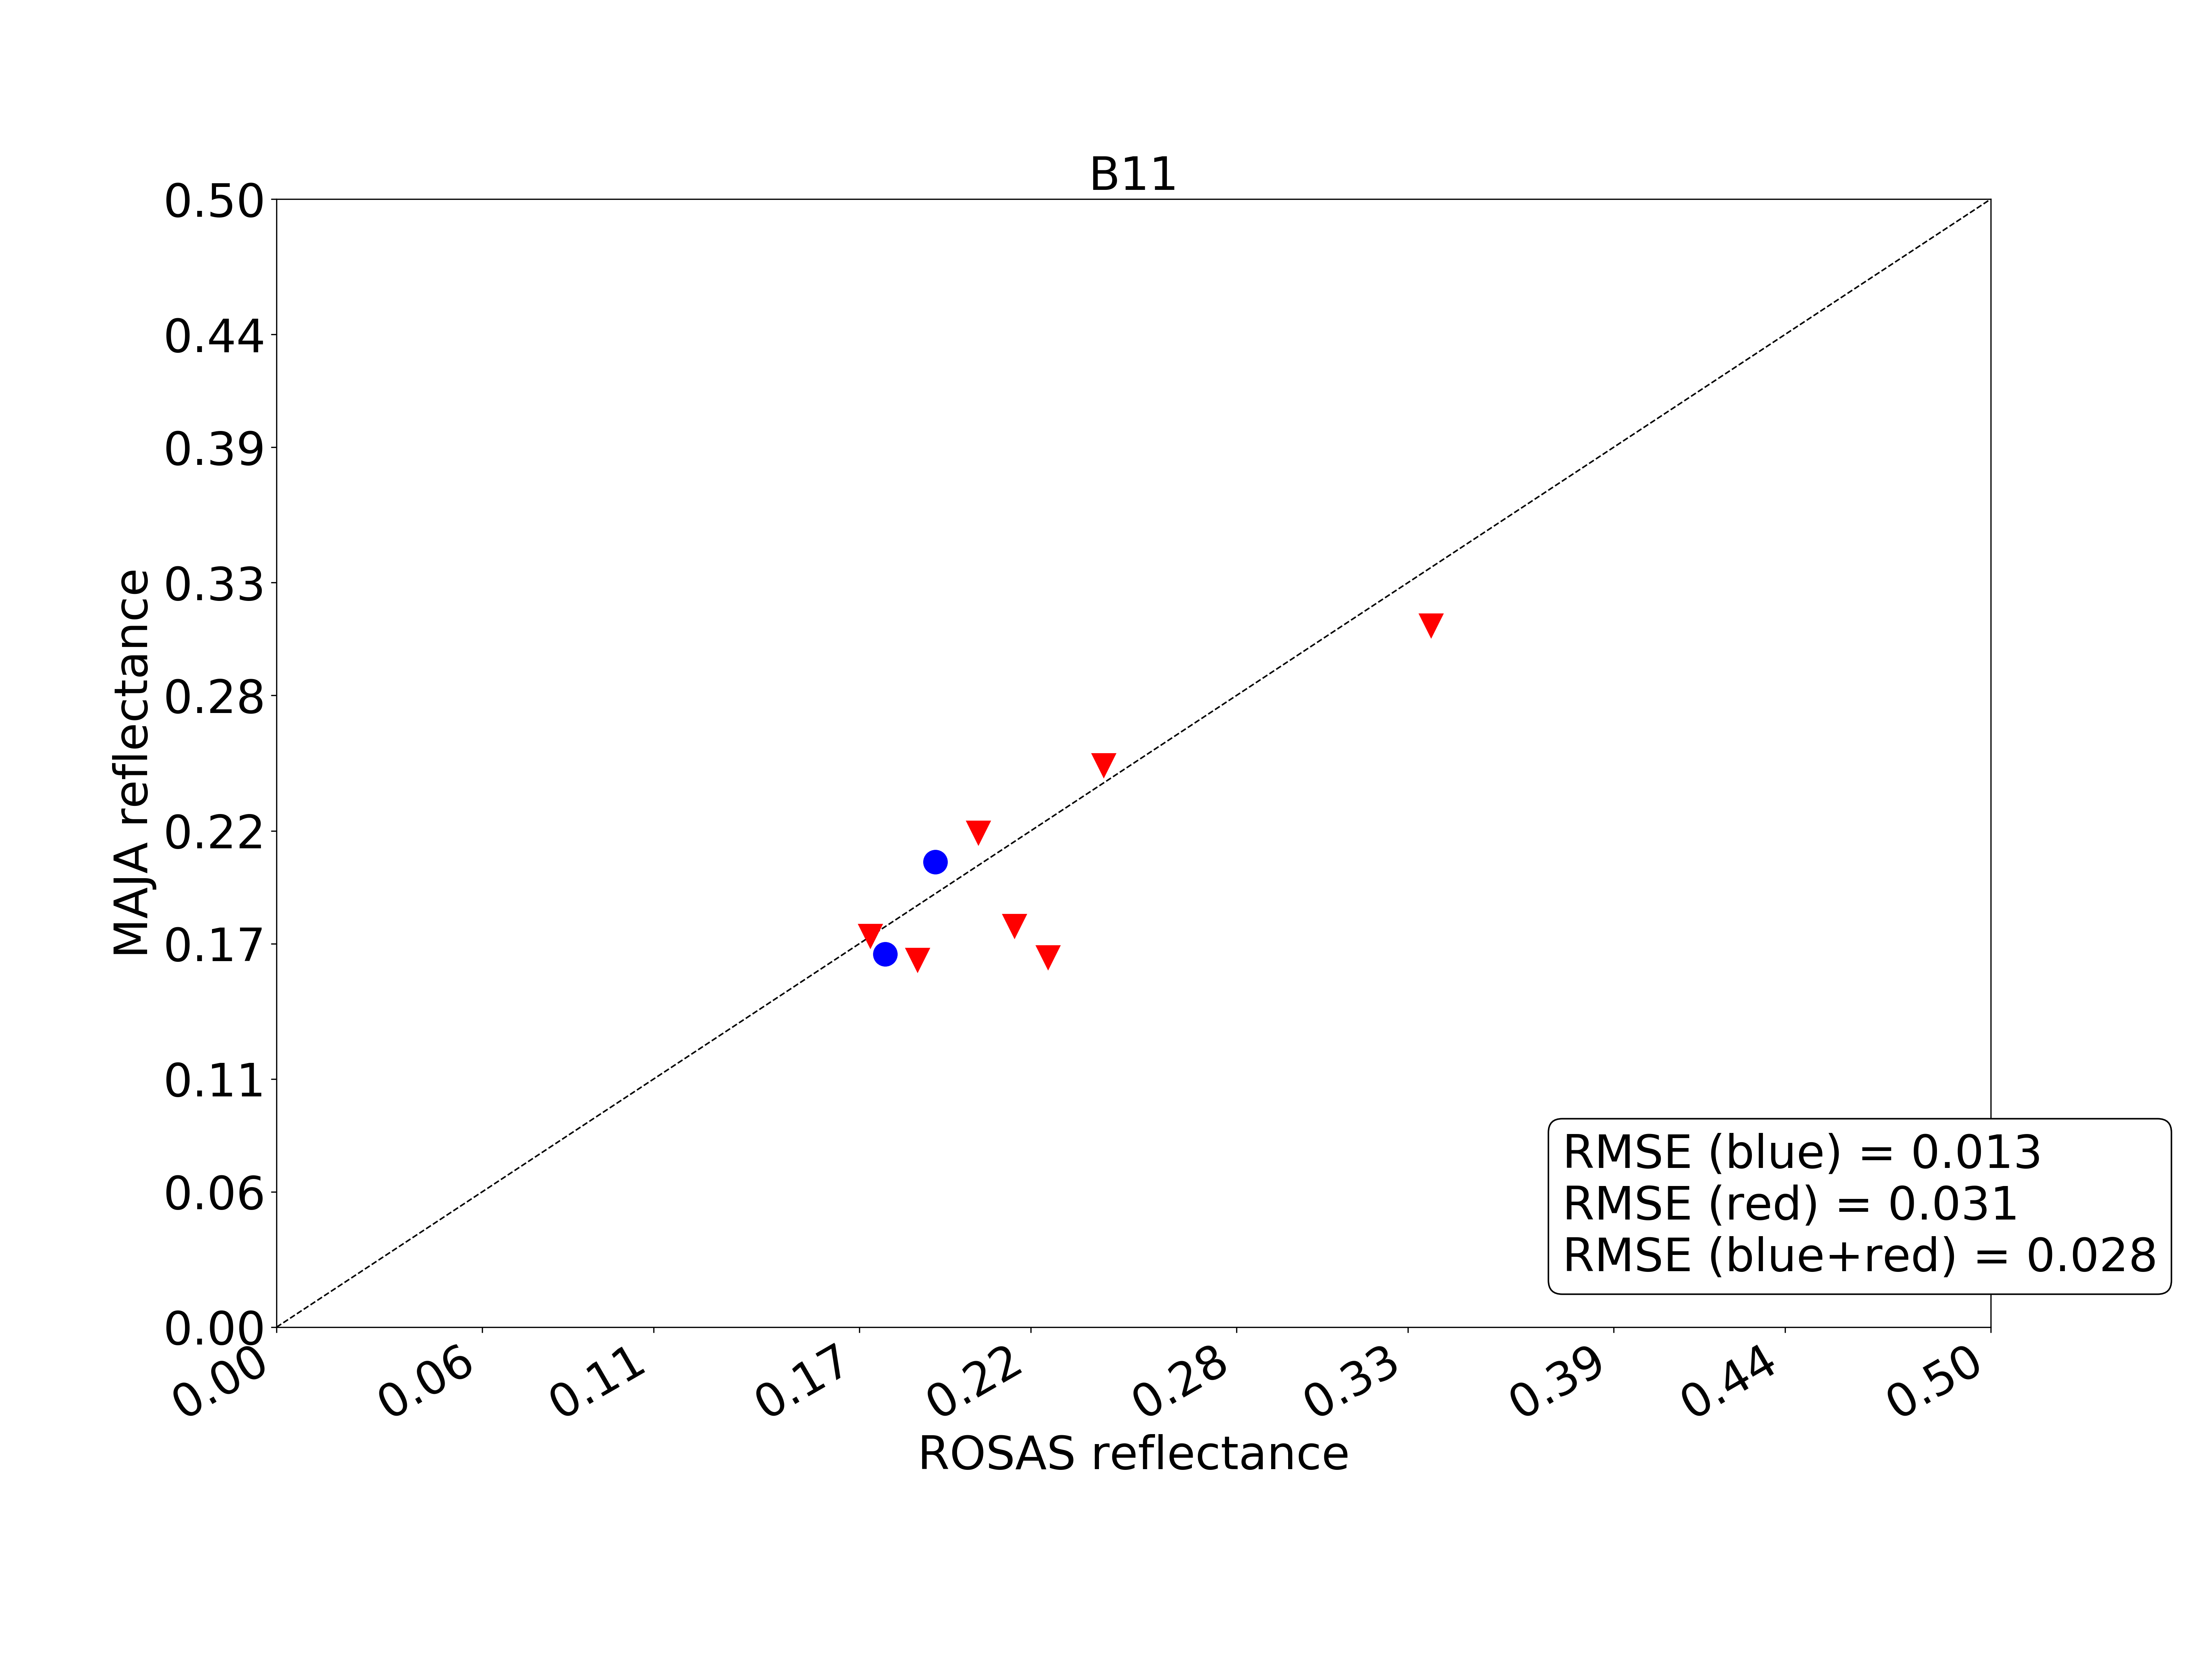 |
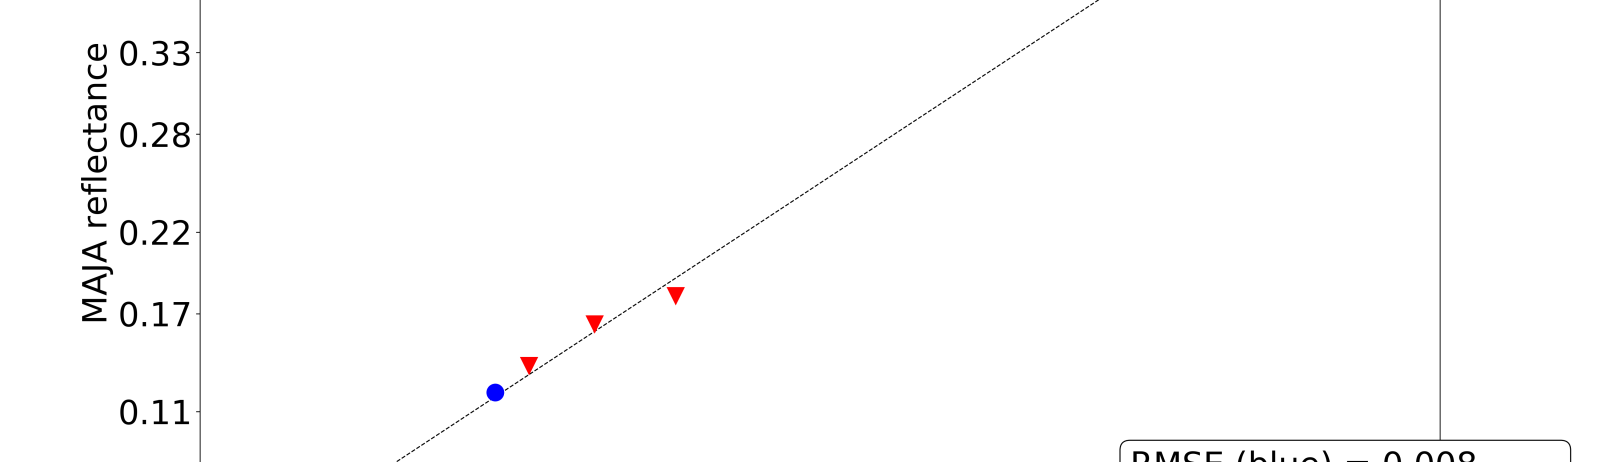
Comparison between ground and satellite measurements at Lamasquère for 4 spectral bands (Blue, Red, Near Infrared, Short Wave infrared), in blue for Sentinel-2A, and in red for Sentinel-2B. Click on the graphs to enlarge.