Feedback on the irrigation scheduling experiment using remote sensing images
CESBIO contributes to an international joint laboratory in Morocco, called TREMA, « Télédétection et Ressources en Eau en Méditerranée semi-Aride », which means « Remote Sensing and Water Resources in Semi-Arid Mediterranean ». This year, this laboratory has embarked on an ambitious experiment of irrigation scheduling by satellite imagery, on a wheat plot near Marrakech. This experiment was already described in March, and it gave very promising results.

The main objective of the experiment was to see if the logistics of irrigation scheduling by water balance model were feasible in real conditions. For this, a farmer accepted to play our game on two four hectares plots of wheat: Irrigation of the reference plot was driven by the farmer in the usual way. The test plot irrigations was driven by our tool SAMIR (FAO-56 model forced by satellite imagery).
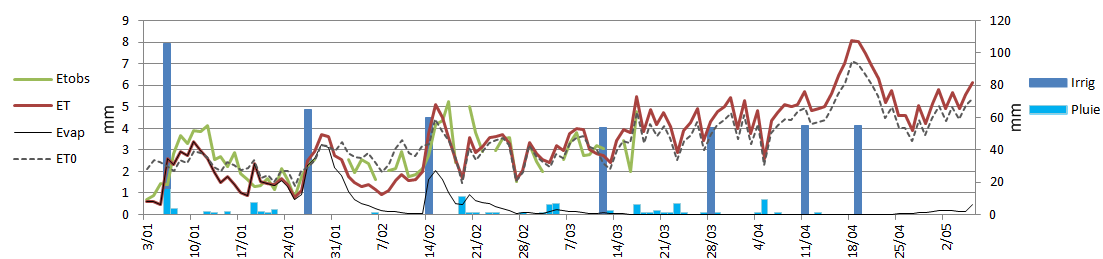
Since the sowing late December to the harvest in early June, a weather station installed on a reference culture has given us the daily reference evapo-transpiration measurements. On the other hand, to control a posteriori the quality of our estimates of water requirements for irrigation, two flux measuring stations were set up. We also acquired a series of images SPOT5 early in the season to compensate for the slightly late start of SPOT4 experience (TAKE5) which began in February.
In addition to a clear weather throughout the season, we were able to benefit from the excellent work of the SPOT4 (TAKE5) team which provided us with the georeferenced images very quickly. The NDVI evolutions were thus available in a relatively short time. As an end user, the Office of Agricultural Haouz allowed us to perform the irrigation of the test plot in the best conditions while being subjected to the constraints of the canal system.
Our experiment has been seriously hampered by the misunderstandings with the farmer. But despite the bad start, the experiment was pursued to its end.
To our surprise, the results are extremely promising. Indeed, despite a 20% lower biomass compared to the plot driven by the farmer, we got a equivalent performance in grain yield. This can be explained by the fact that, although the average number of wheat blades was much lower on the test plot, it is very likely that the reference plot, irrigated by the traditional method, has suffered water stress in late March limiting the filling of grain.
This full-scale experiment finally turned out to be very instructive. First, imaging/weather/irrigation logistics worked great : the weather data transmission, the reception and the geometric and radiometric correction of images, the model runs and irrigation decision were largely automated. The SPOT4 (Take5) data, that prefigure those of Sentinel-2, proved perfectly suited to this application. Unfortunately, the clay crust has severely limited the emergence of culture. Yet this phenomenon, well-known to our farmer, taught us to cultivate humility ;-), and we will consider the introduction of the risk in a decision support system. Finally, the functional constraints of the gravity irrigation system have taught us that our tool should be more flexible to recommend an irrigation period instead of a single date, and that we should link the service to weather forecasts.
Following this experiment, we started developing a Web service (SAT-IRR) that should shortly provide the essential functions of an irrigation decision support with a simplified interface.