Capturing the Diurnal Cycle of Urban Overheating with ECOSTRESS data
The successive heat waves of the summer of 2026 remind us of the urgent need to take action to adapt to episodes of extreme heat that are set to become more frequent, intense, and occur earlier in the year. In this context, the urban heat island effect emerges as a major problem. Indeed, cities, as they are built today, have temperatures that are several degrees higher than those in adjacent rural areas. Heat waves are therefore more intense in cities, as are the adverse effects associated with them. Consequently, a detailed understanding of the mechanisms behind this overheating is essential for implementing effective mitigation solutions.
However, while the concept is simple to describe, a detailed analysis of this phenomenon is complicated by the extreme spatial heterogeneity of urban environments, on the one hand, and by the complexity of the mechanisms at play and their temporal dynamics, on the other.
Satellite imagery is a useful tool for observing spatial variations in urban surface temperature, and as a result, it has been the subject of numerous studies at various scales. Observing temporal dynamics, however, remained out of reach until recently—particularly at the intra-urban scale—due to limitations imposed by the revisit frequency and fixed overpass times of sun-synchronous satellites. A few observations exist in the literature, but they are based on data from sensors with low spatial resolution (e.g., NOAA-AVHRR 1 km), which have a high revisit frequency but do not allow for measurements at the neighborhood scale.
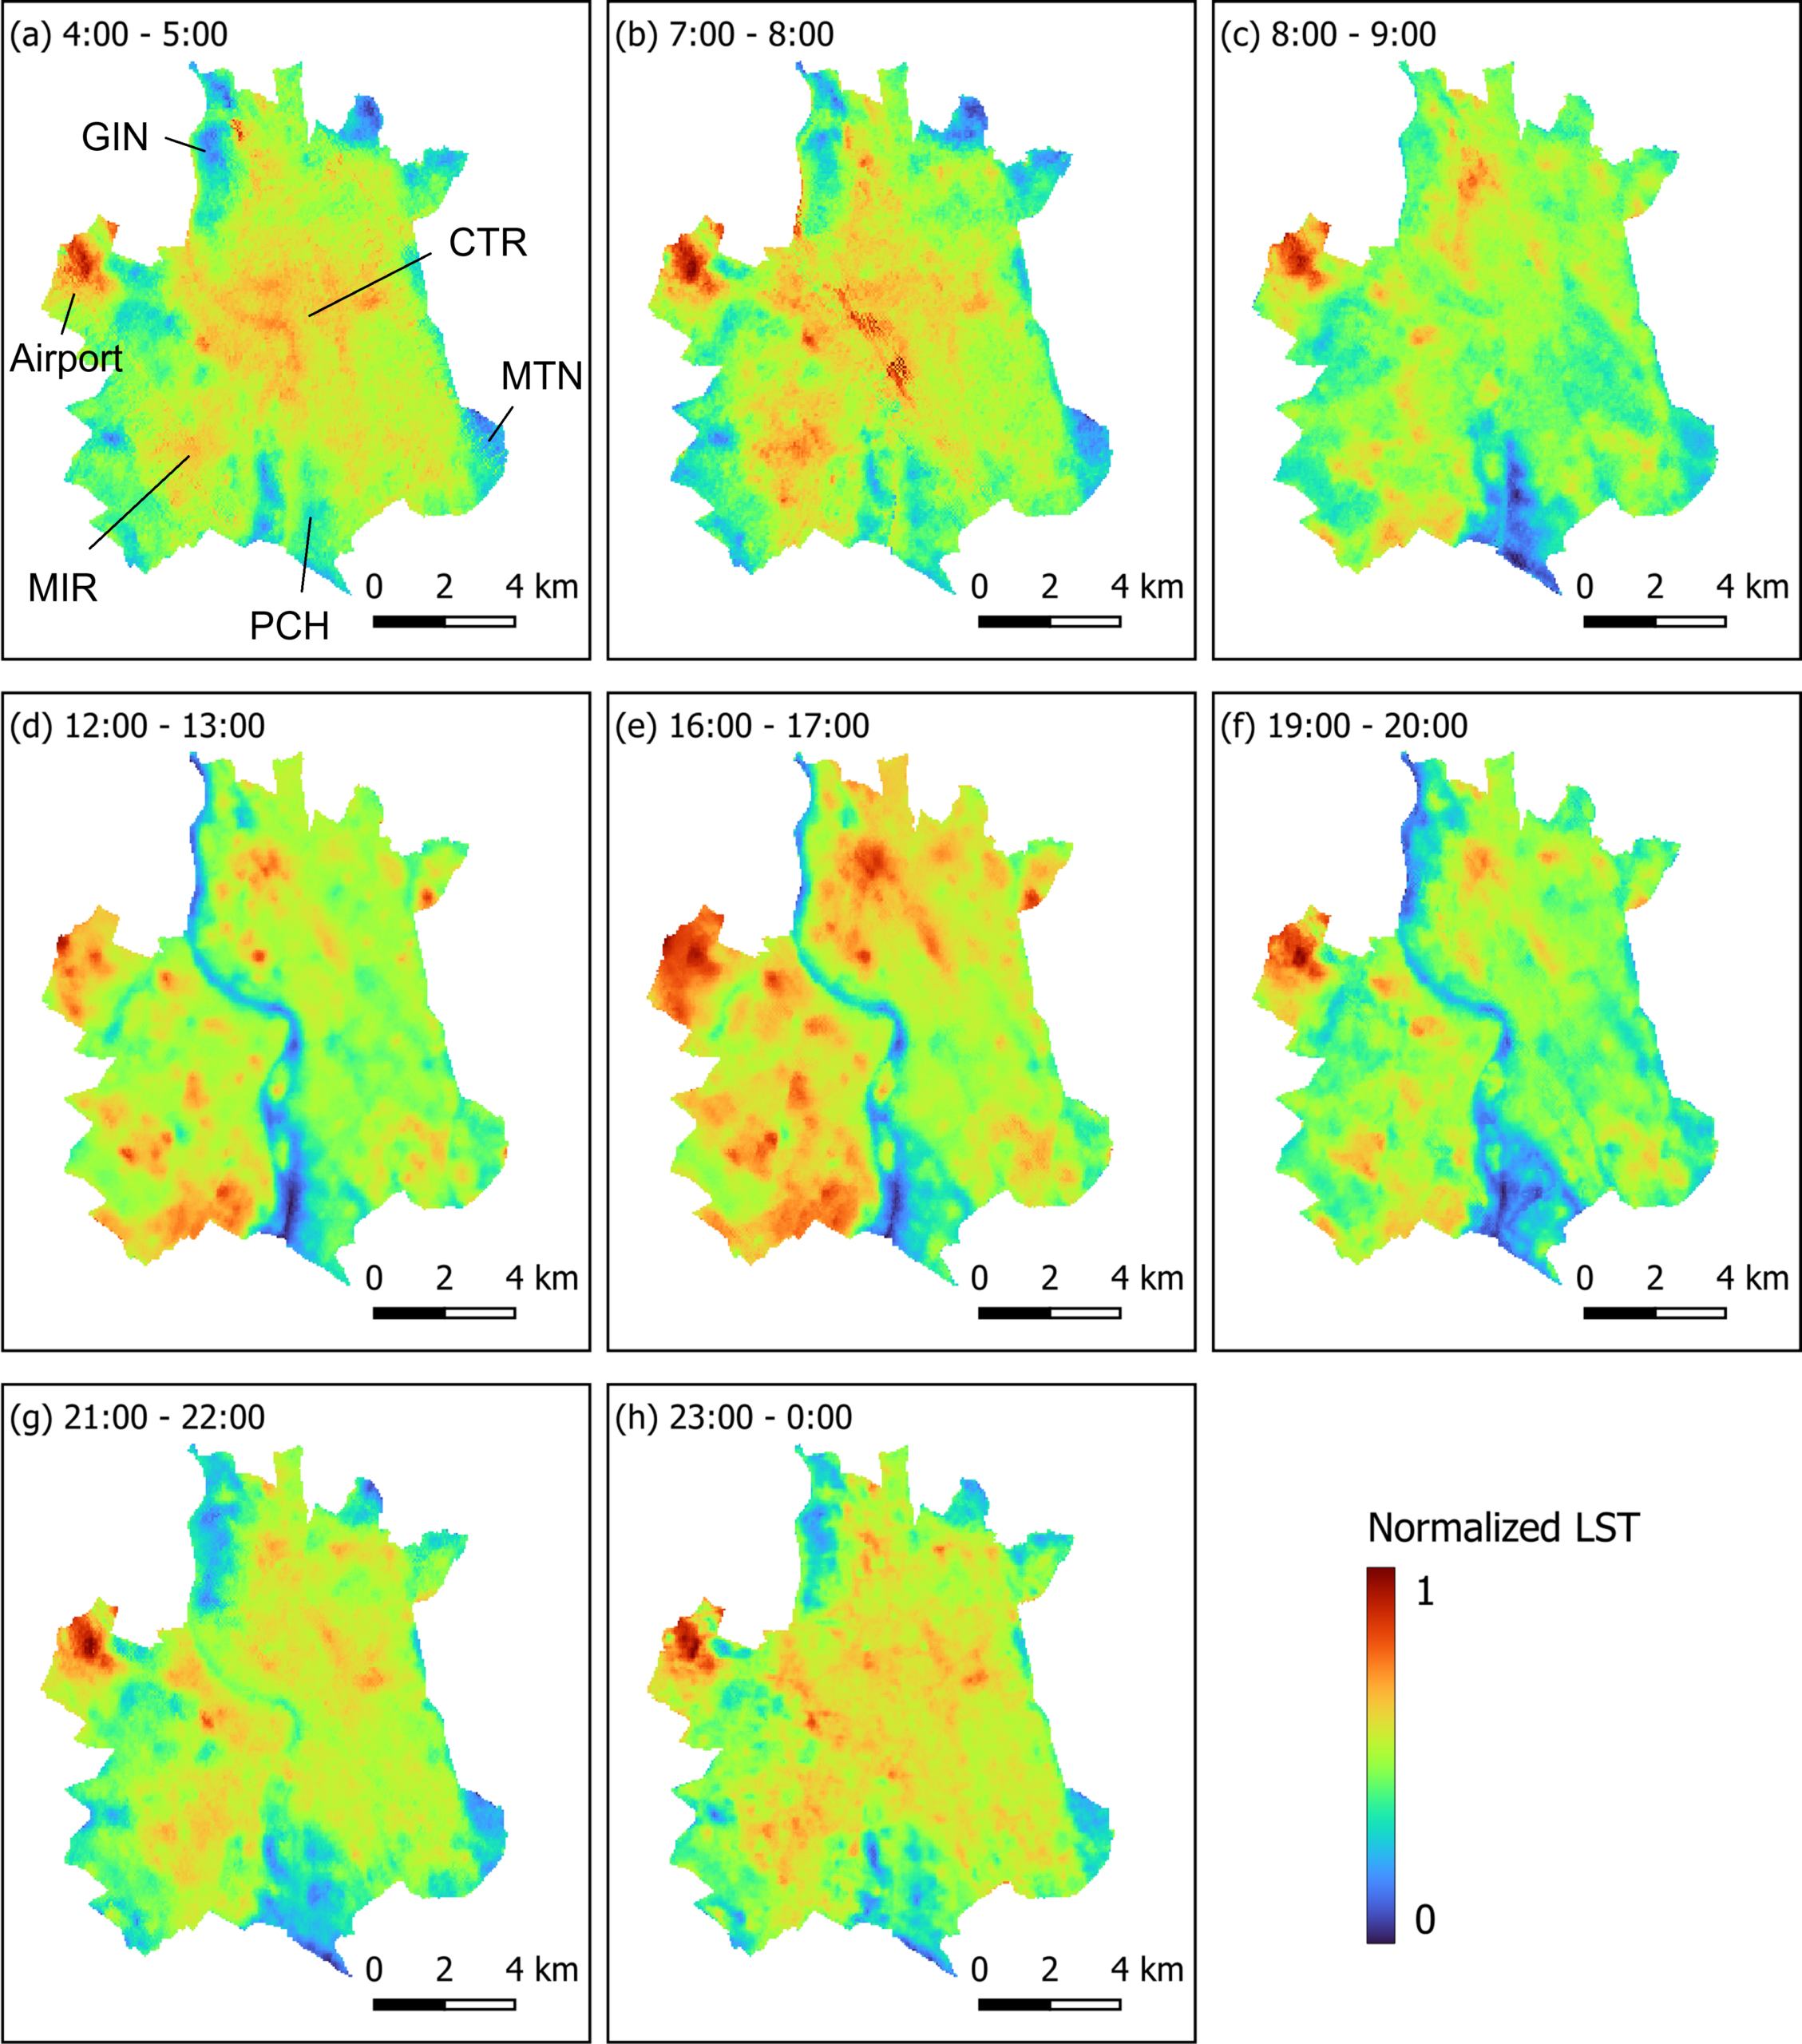
We have just published an open-access article in Urban Climate that analyzes the temporal dynamics of the surface urban heat island in Toulouse (France) at the neighborhood scale, using data from the ECOSTRESS sensor aboard the ISS. The study was conducted at Cerema in collaboration with Cesbio and ONERA.
Nédélec, R., Lopez, T., Bouyer, J., Michel, A., Rivalland, V., Piccinini, B., 2026. Diurnal cycle of the surface urban heat island at the intra-urban scale derived from ECOSTRESS observations and local climate zones. Urban Climate 68, 103019. https://doi.org/10.1016/j.uclim.2026.103019
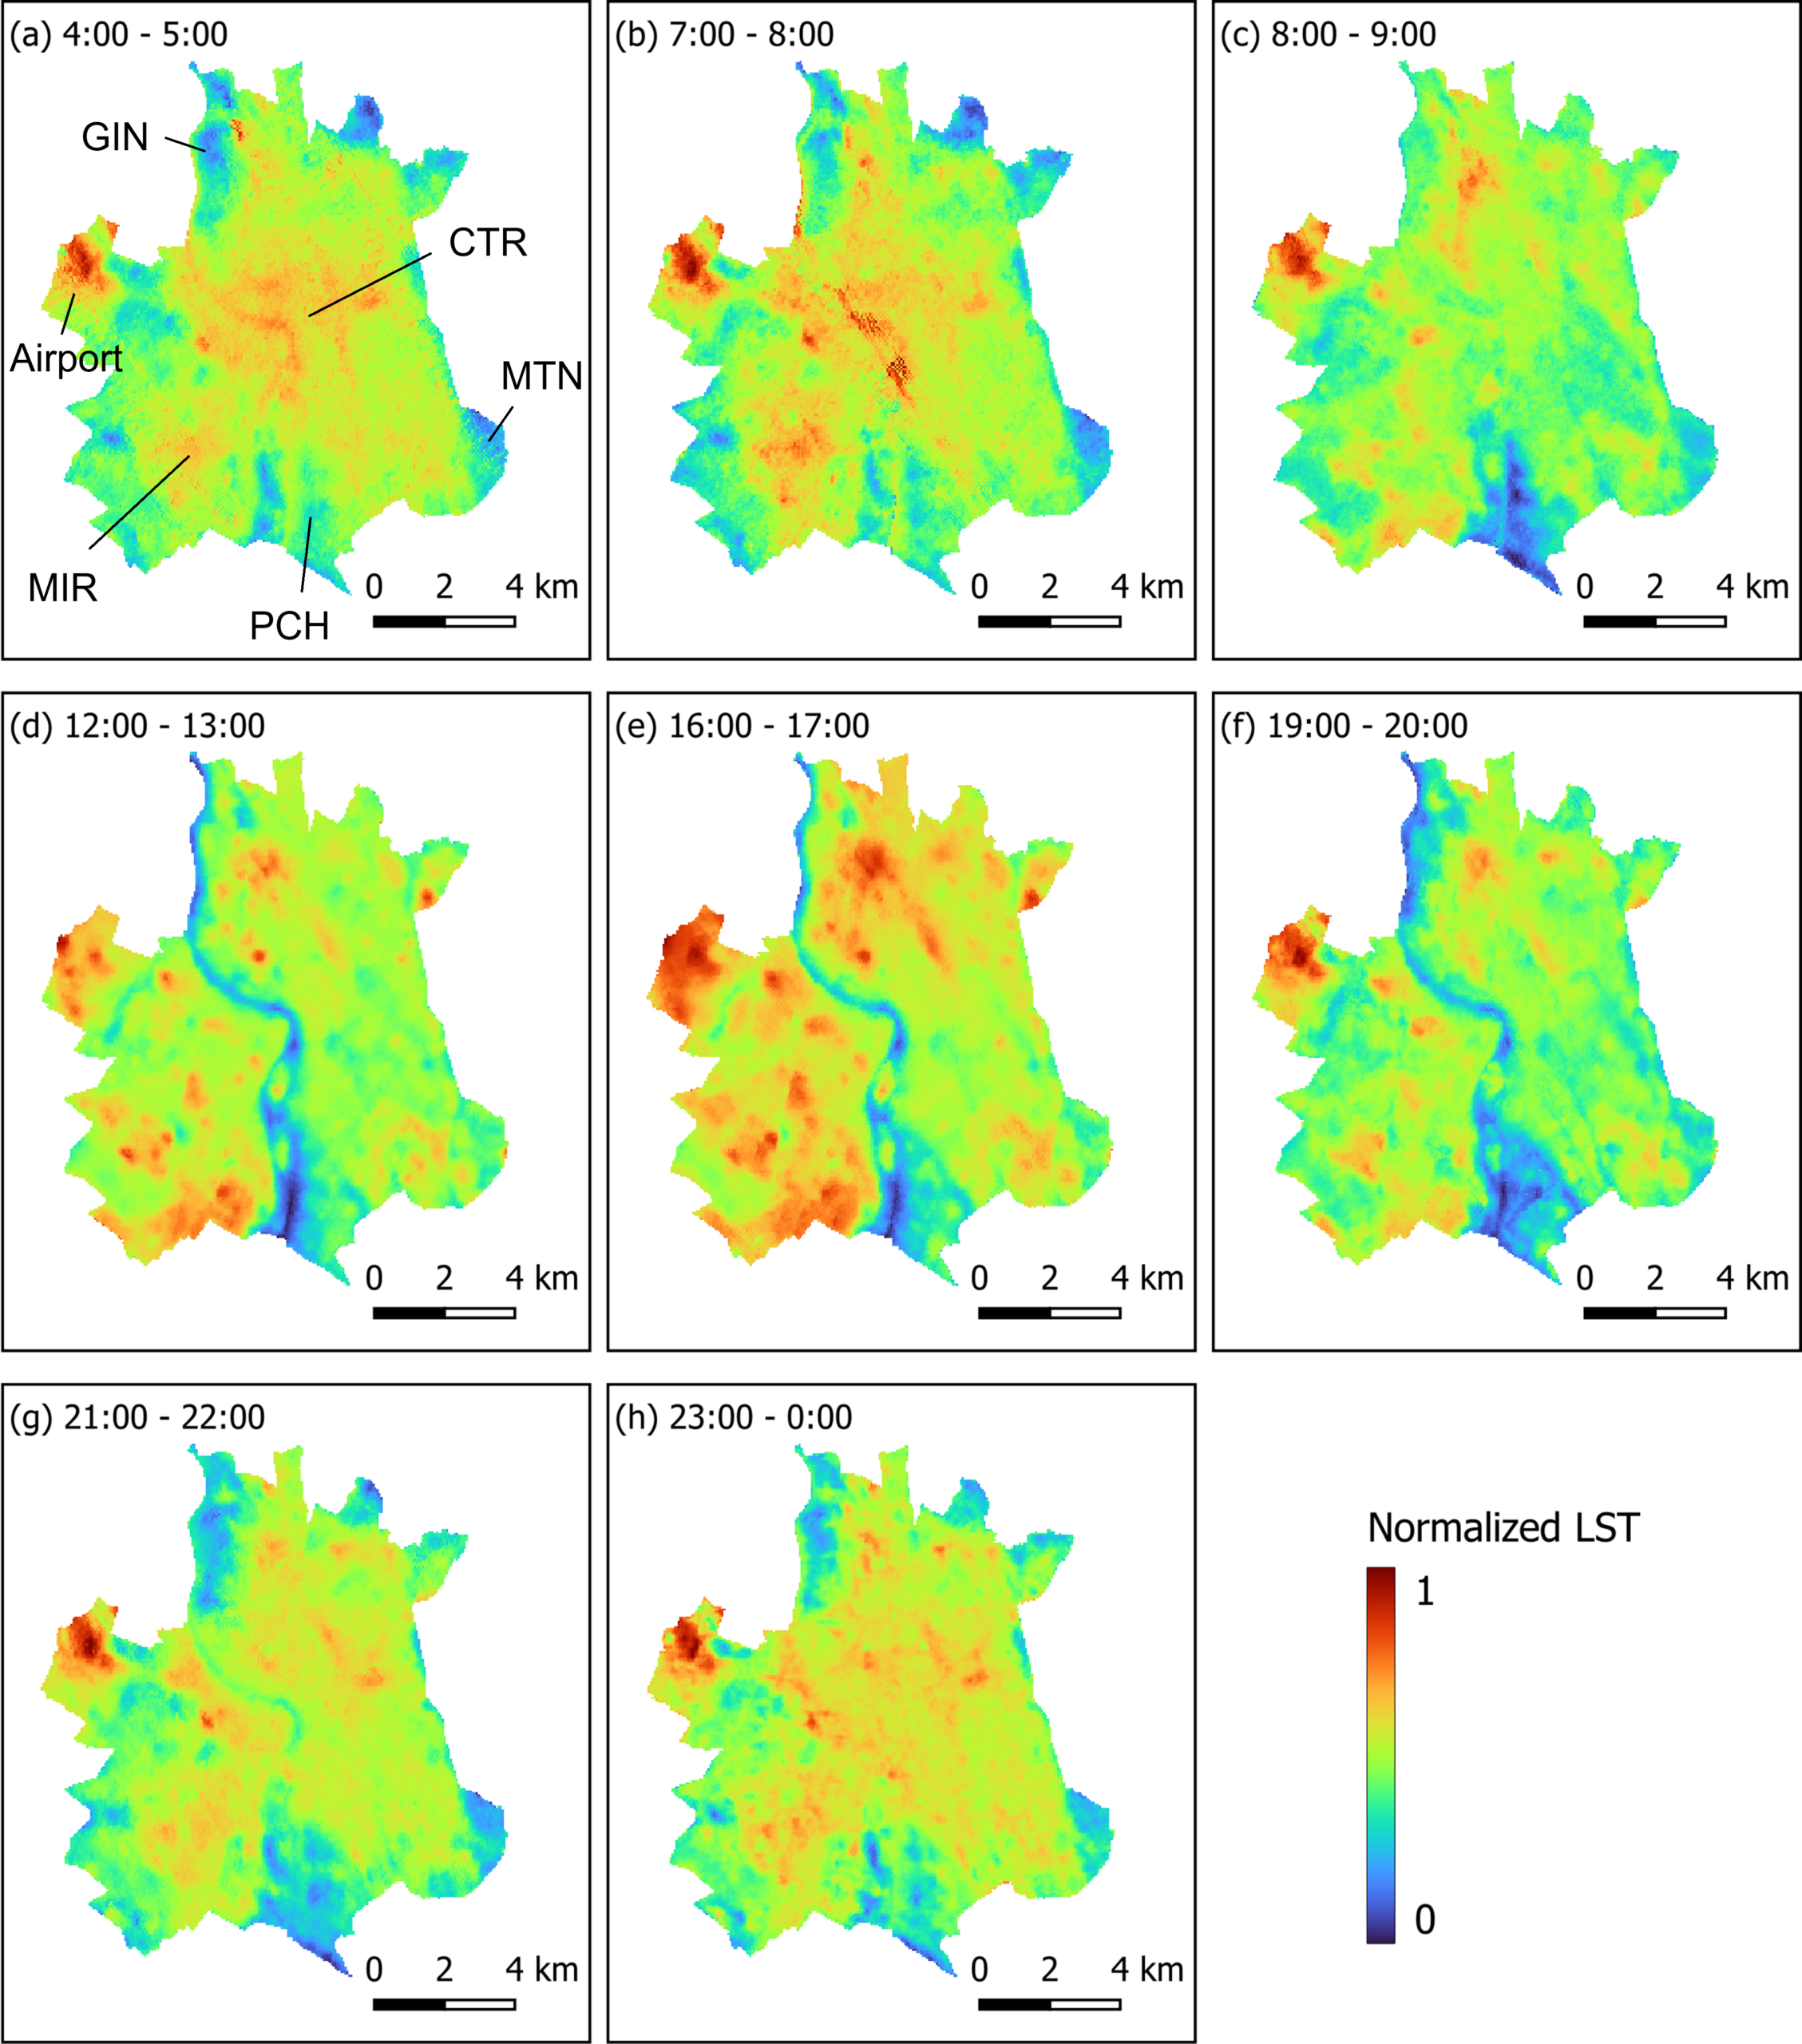
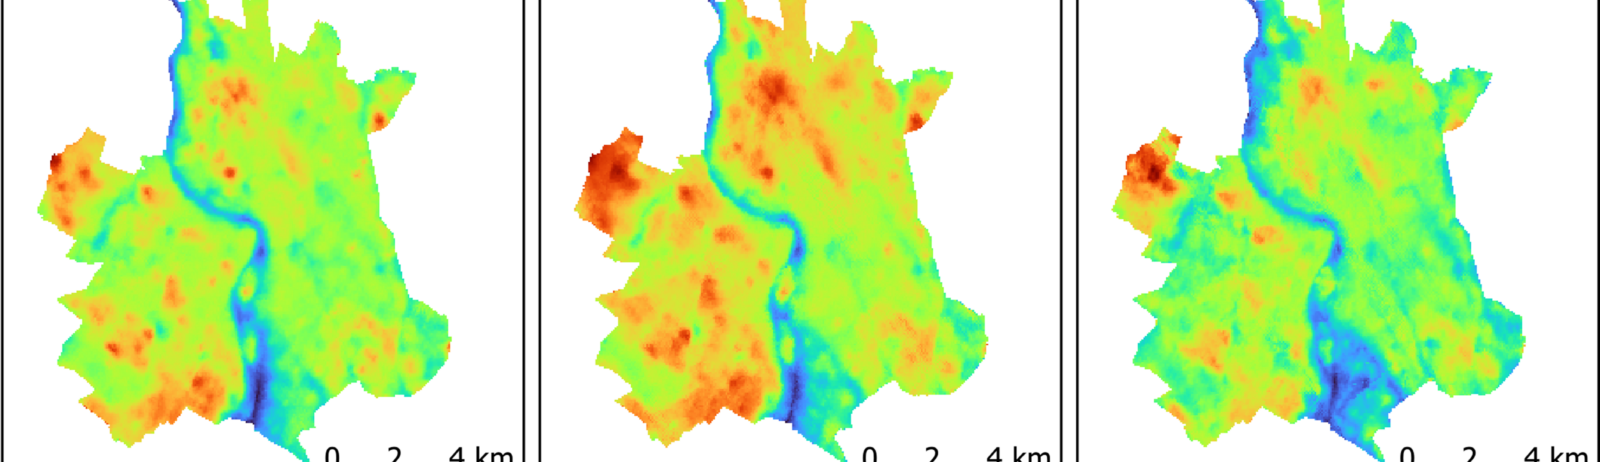
Unlike sun-synchronous satellites, ECOSTRESS—installed aboard the International Space Station—enables data acquisition at various times of day and night with a resolution of 70 m. This allowed us to study the diurnal cycle of surface temperatures using a time series of Land Surface Temperature (LST) data derived from 60 ECOSTRESS images and 4 ASTER images. To do this, we proposed a data normalization methodology to separate day-to-day variations from variations purely related to the diurnal temperature cycle.
To analyze local surface temperature dynamics, we relied on the Local Climate Zones (LCZ) classification method proposed by Stewart and Oke (2012), which classifies urban areas based on land-use and morphological criteria. The classification criteria are chosen so that each class corresponds to a specific type of urban microclimate, providing an objective framework for describing the urban environment that is suitable for microclimatic studies.
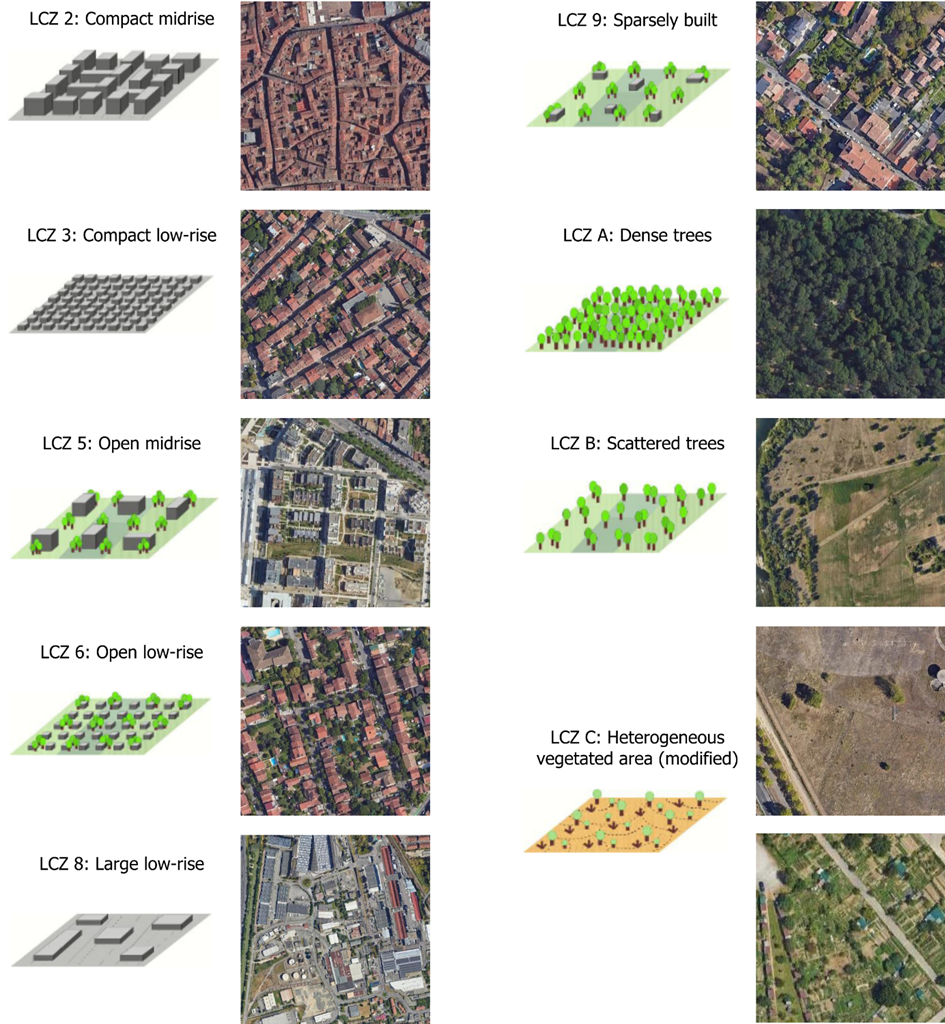
In this study, we used the LCZ maps produced by Cerema. Cerema has developed a methodology to automatically generate LCZ maps for the whole of France, covering all cities with a population of 50,000 or more, and this data is publicly available12.
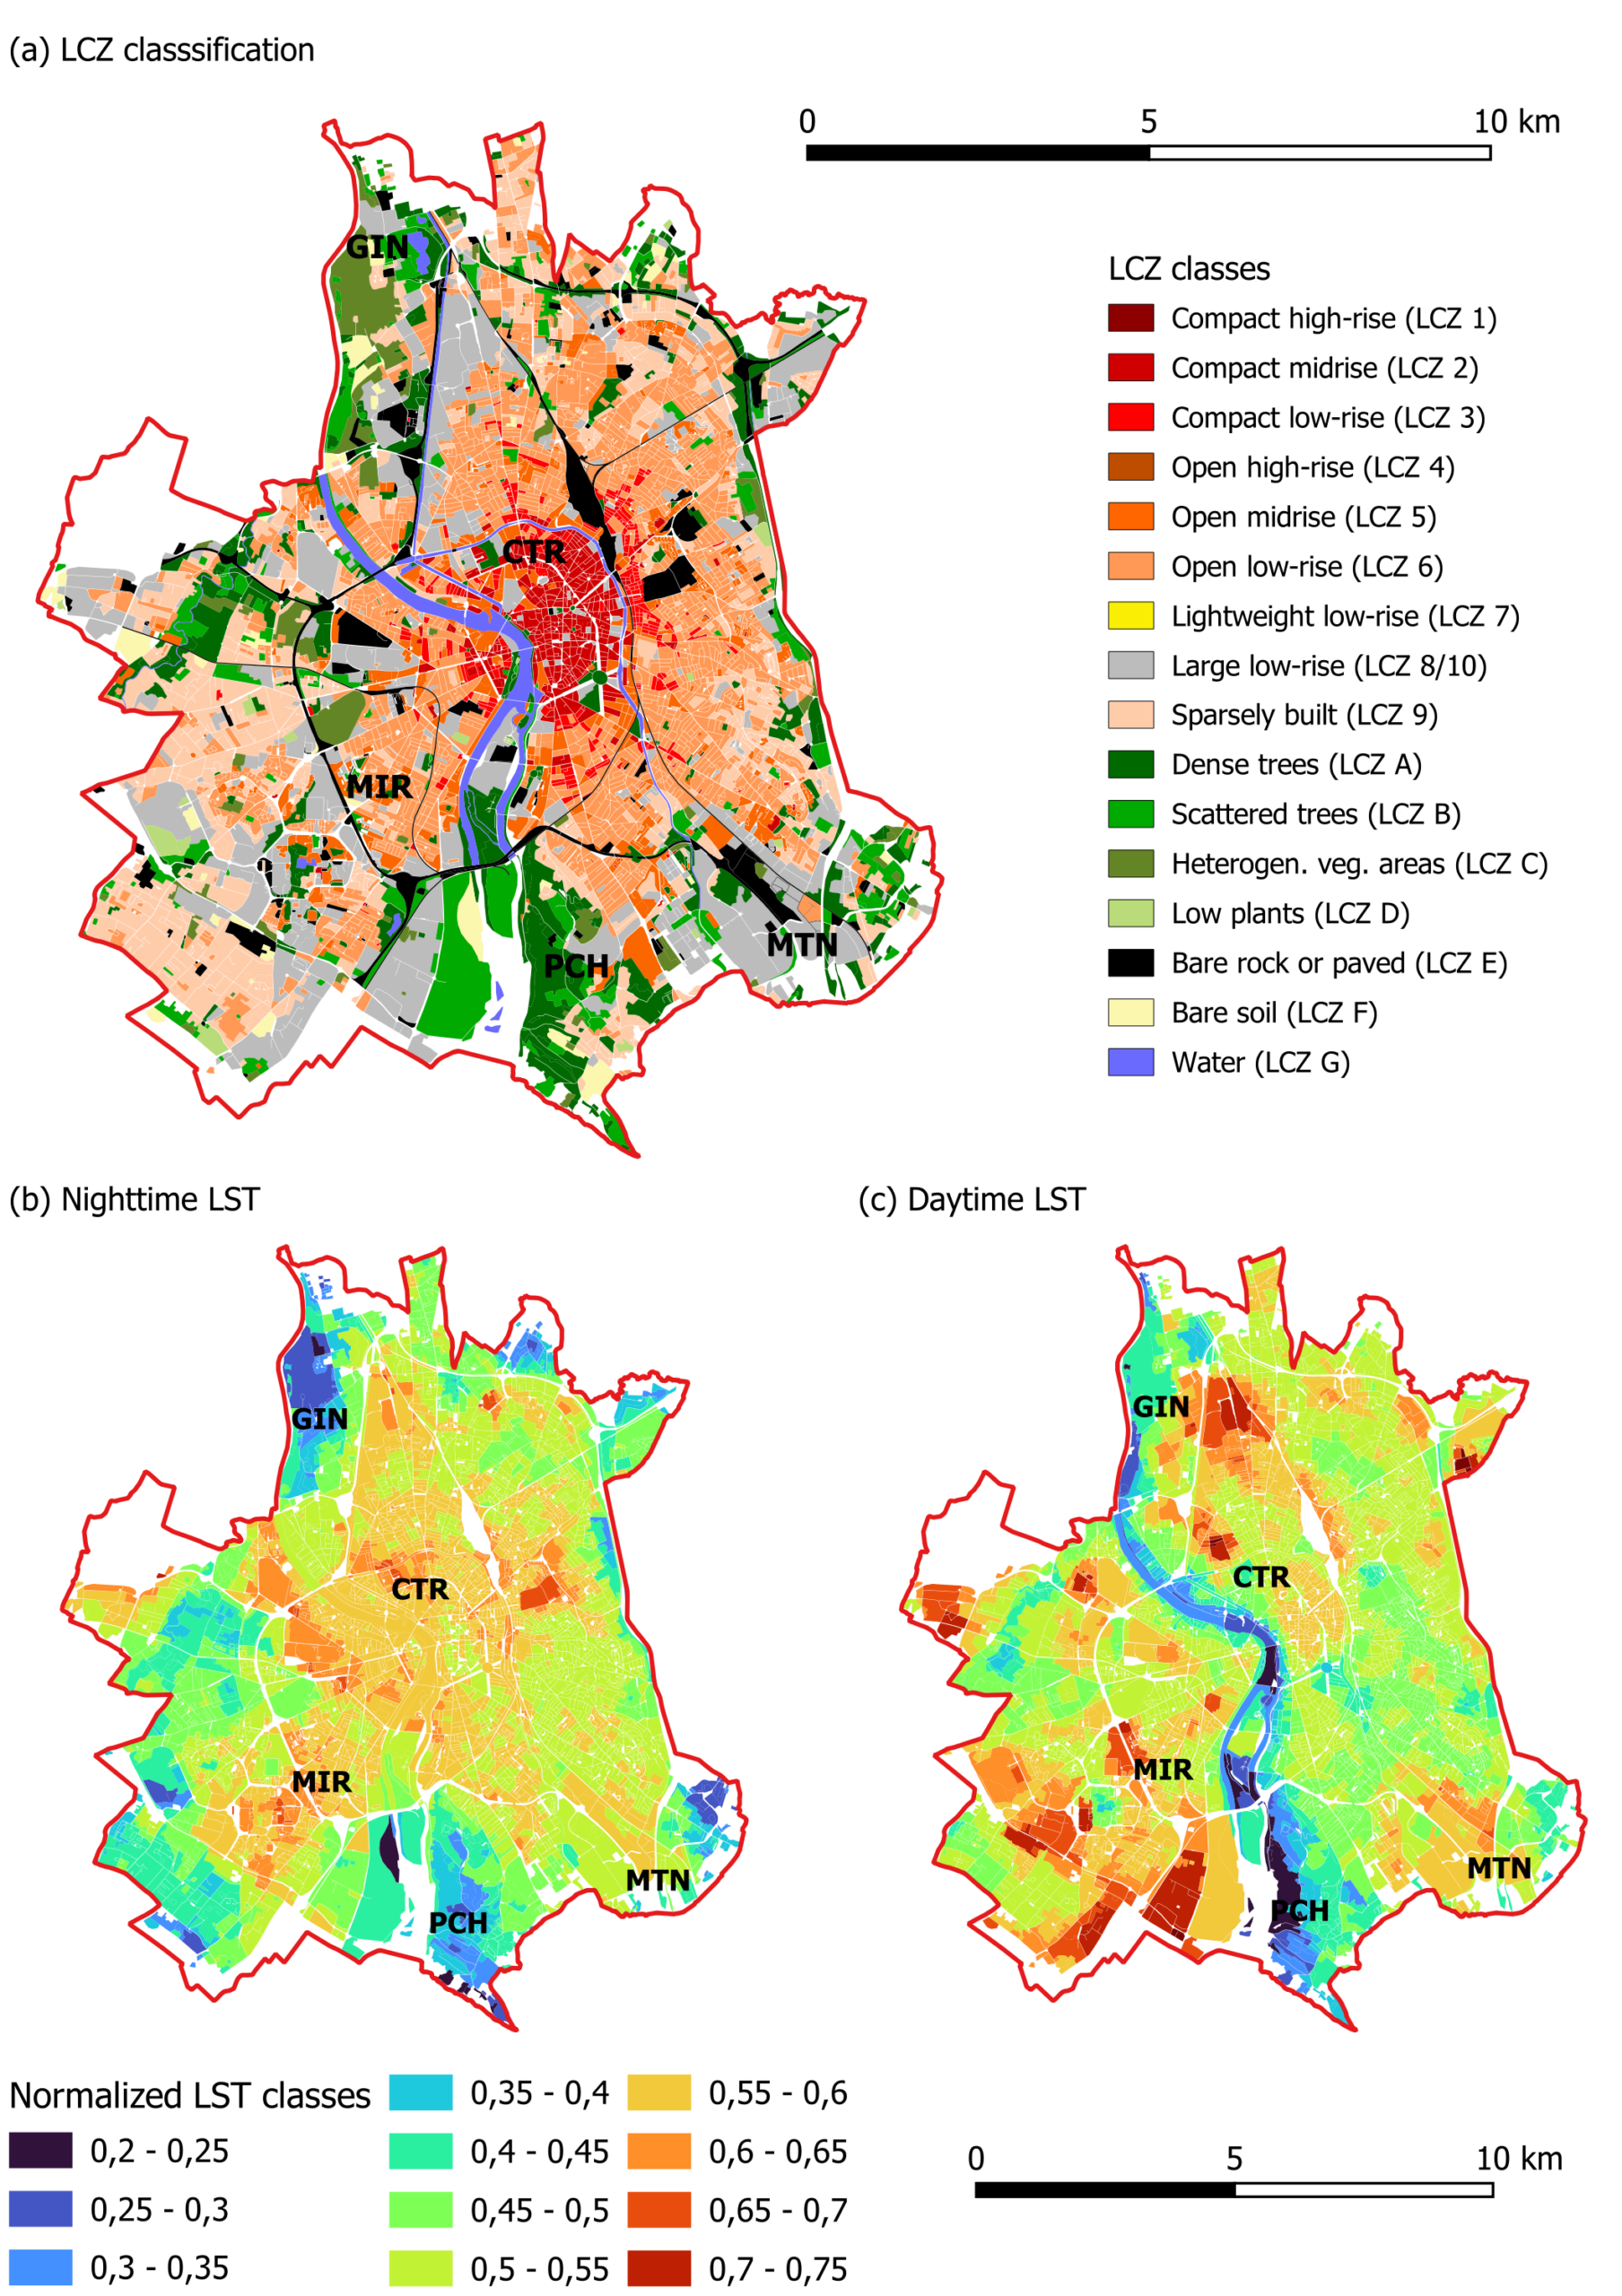
This study produced average evolution curves of surface urban heat island (SUHI) intensity for three types of neighborhoods throughout the day and night. Our results show, in particular, how neighborhoods characterized by low-rise buildings (LCZ 8)—which often correspond to business or industrial zones—experience a rapid rise in surface temperature early in the day —reaching a difference of about 4°C compared to the city’s forested areas (LCZ A) by midday—and cool down just as quickly starting in the early evening. The densest downtown neighborhoods (LCZ 2), by contrast, warm up slowly by storing heat throughout the day and remain at a high temperature throughout the night, with an average temperature difference of around 2°C compared to the city’s heterogeneous low-vegetation areas (LCZ C), which are the coolest at night.
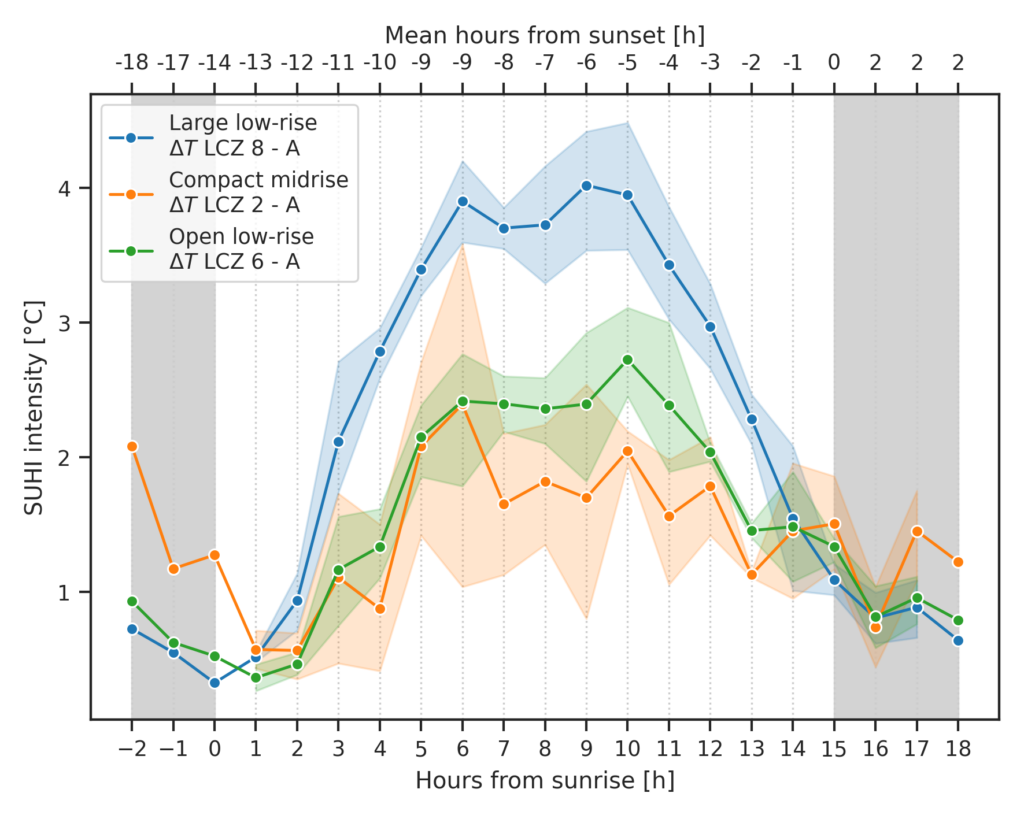

In practical terms, the thermal radiation emitted by rooftops throughout the night is therefore likely to significantly increase heat stress during heat waves, particularly in dense downtown neighborhoods (LCZ 2). Other neighborhoods, such as the Mirail-Reynerie neighborhood (LCZ 2–5), also appear to exhibit a similar pattern based on an initial analysis.
References
Nédélec, R., Lopez, T., Bouyer, J., Michel, A., Rivalland, V., Piccinini, B., 2026. Diurnal cycle of the surface urban heat island at the intra-urban scale derived from ECOSTRESS observations and local climate zones. Urban Climate 68, 103019. https://doi.org/10.1016/j.uclim.2026.103019
Stewart, I.D., Oke, T.R., 2012. Local Climate Zones for Urban Temperature Studies. Bulletin of the American Meteorological Society 93, 1879–1900. https://doi.org/10.1175/BAMS-D-11-00019.1