A sneak peak at the first SWOT hydrology products
SWOT, the Surface Water and Ocean Topography mission was successfully launched more than a year ago (Dec 16, 2022). Hydrologists are eagerly awaiting the release of SWOT products, which will allow them to study for the first time the water levels variations of more than a million lakes and rivers around the globe!
A first batch of products from the SWOT mission has been released by NASA and CNES. As explained in the release note, these SWOT products are « at a very early stage, with known limitations ». The hydrology products span only two weeks in April 2023. However, I could not resist to have a look at the data… Hence I downloaded some level 2 hydrology products via the CNES Hydroweb.next portal (https://hydroweb.next.theia-land.fr). The datasets are distributed as shapefile and convenient to use. The Level 2 High Rate River Single Pass Vector Product provides river data – including water surface elevation of the river. Here is an example of the surface water elevation of the Oranje river in southern Africa.
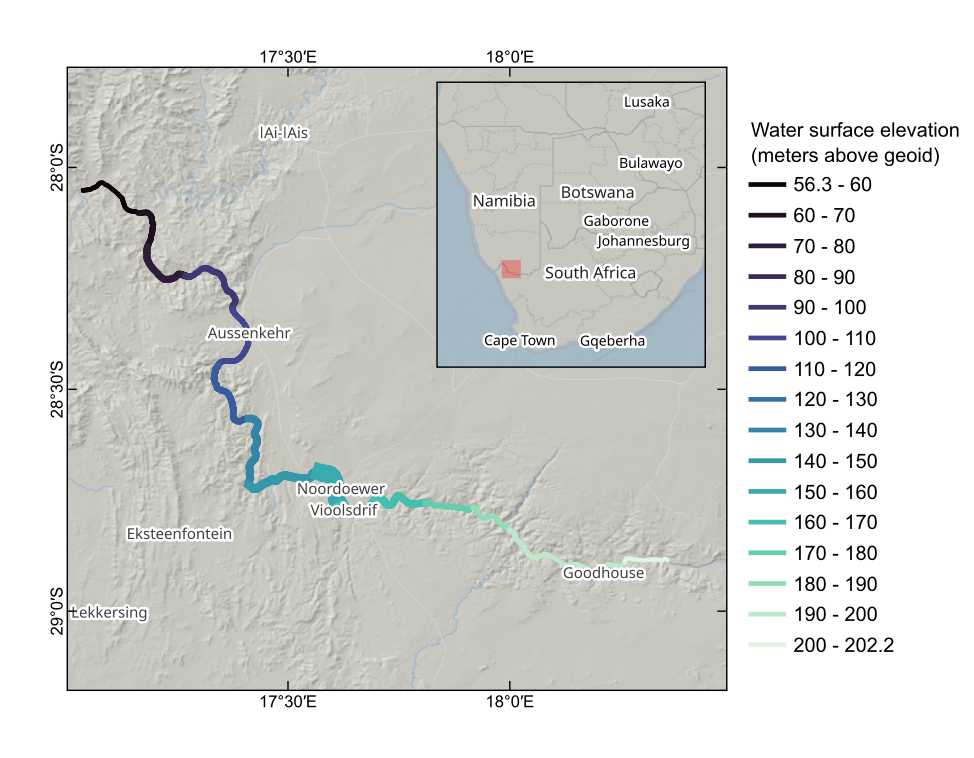
It is quite amazing to be able to map a river’s elevation profile from satellite measurements. Such data is key to estimate the river discharge [Durand et al] and therefore should enable us to make considerable progress in our understanding of the terrestrial water cycle. SWOT is expected to measure river surface elevation with an accuracy of approximately 10 cm at 100–200 m along-stream resolution [Langhorst et al.]. Several teams are already working to evaluate the actual accuracy depending on the river morphology.
Similarly, the High Rate Lake Single Pass Vector Product provides the surface elevation of lakes. To begin with, I picked four artificial lakes in northern India near Varanasi (Benares). In this case, the lake polygons match well the water surfaces that can be seen in a Sentinel-2 image acquired four days earlier.
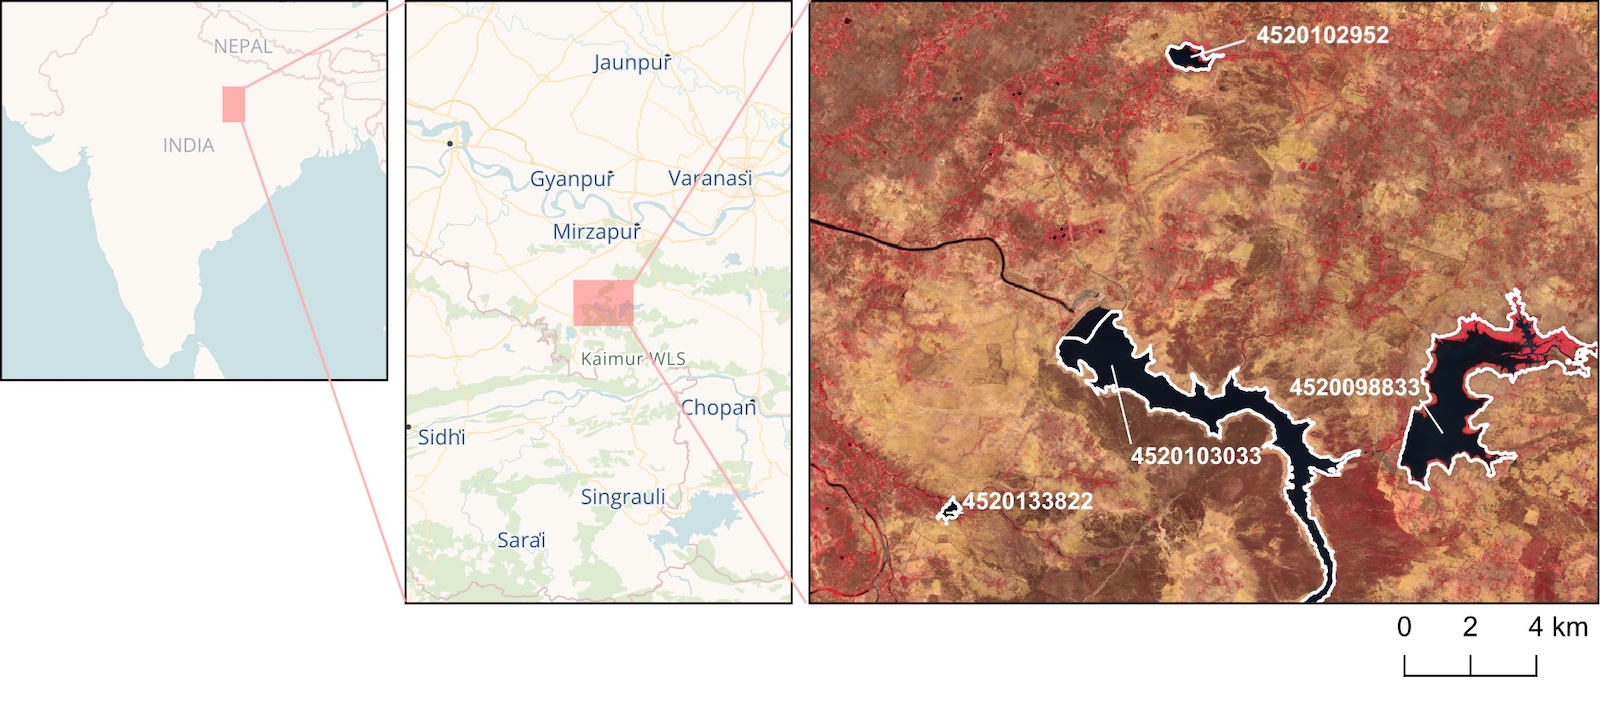
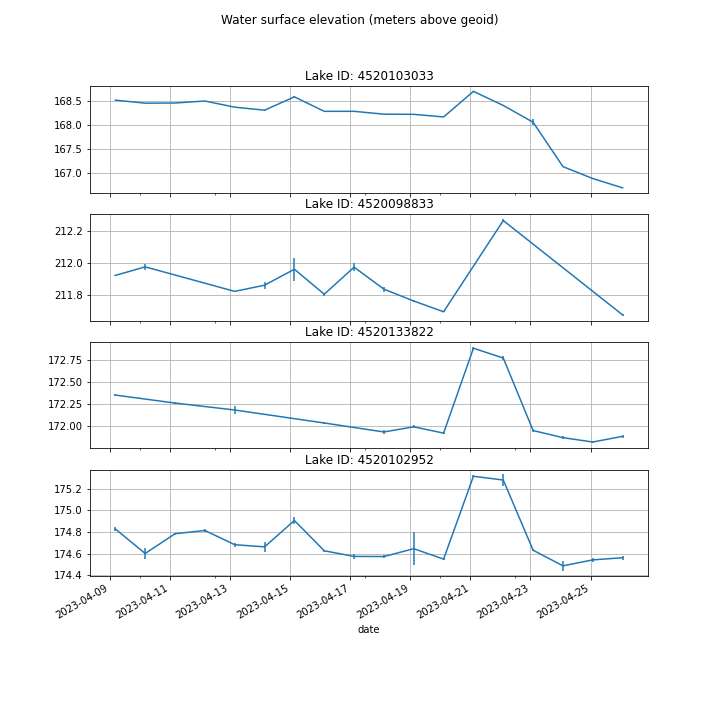
In SWOT products, each lake has an ID. A lake’s attributes including its mean water surface elevation (wse) and uncertainty (wse_u) can be retrieved in a terminal using ogrinfo from a level 2 file:
file="SWOT_L2_HR_LakeSP_(...).zip"
id="4520103033" # lake ID
ogrinfo /vsizip/$file -nomd -al -geom=NO -where "lake_id='${id}'"
This is the output from all available preliminary SWOT products at these four Indian reservoirs.
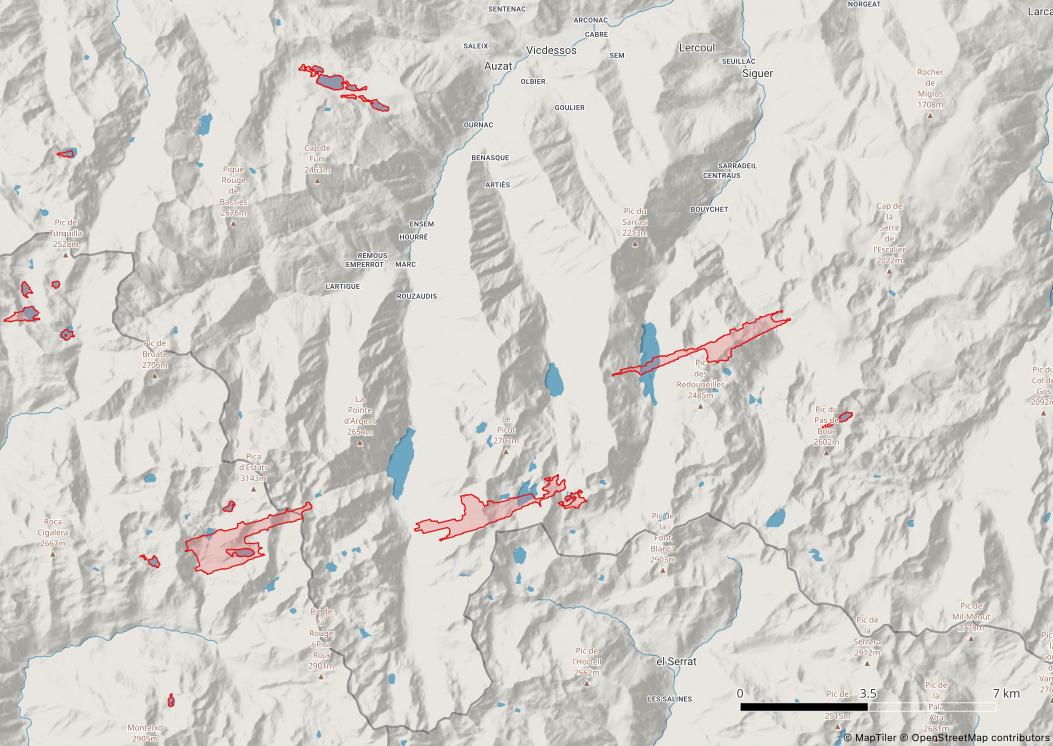
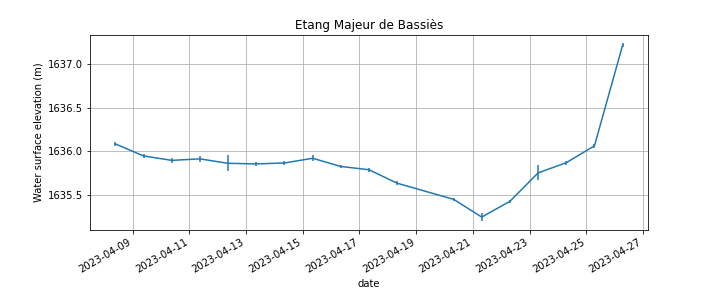
I am a bit more familiar with lakes in the French Pyrenees. There are many cases where SWOT lake polygons (red polygons in the map below) are off the actual lake position, both in the « obs » and « prior » products. Be careful if you use SWOT data in mountain regions!
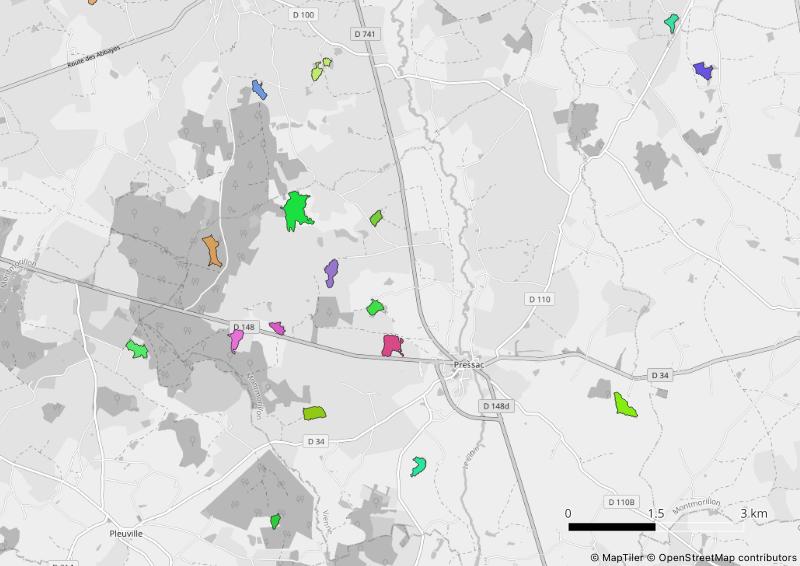
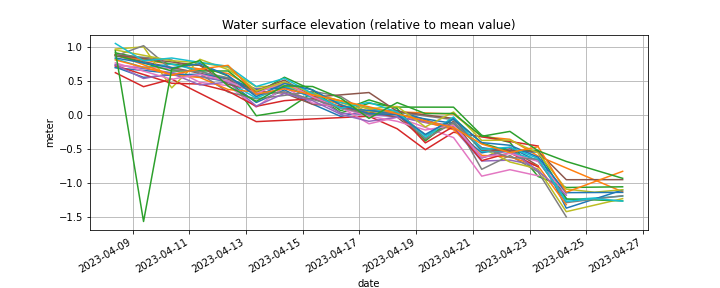
Below is another example in western France near Pressac, where there are many small lakes and ponds. From the SWOT product, I selected 23 lakes with areas ranging from 3 to 19 hectares, all well located.
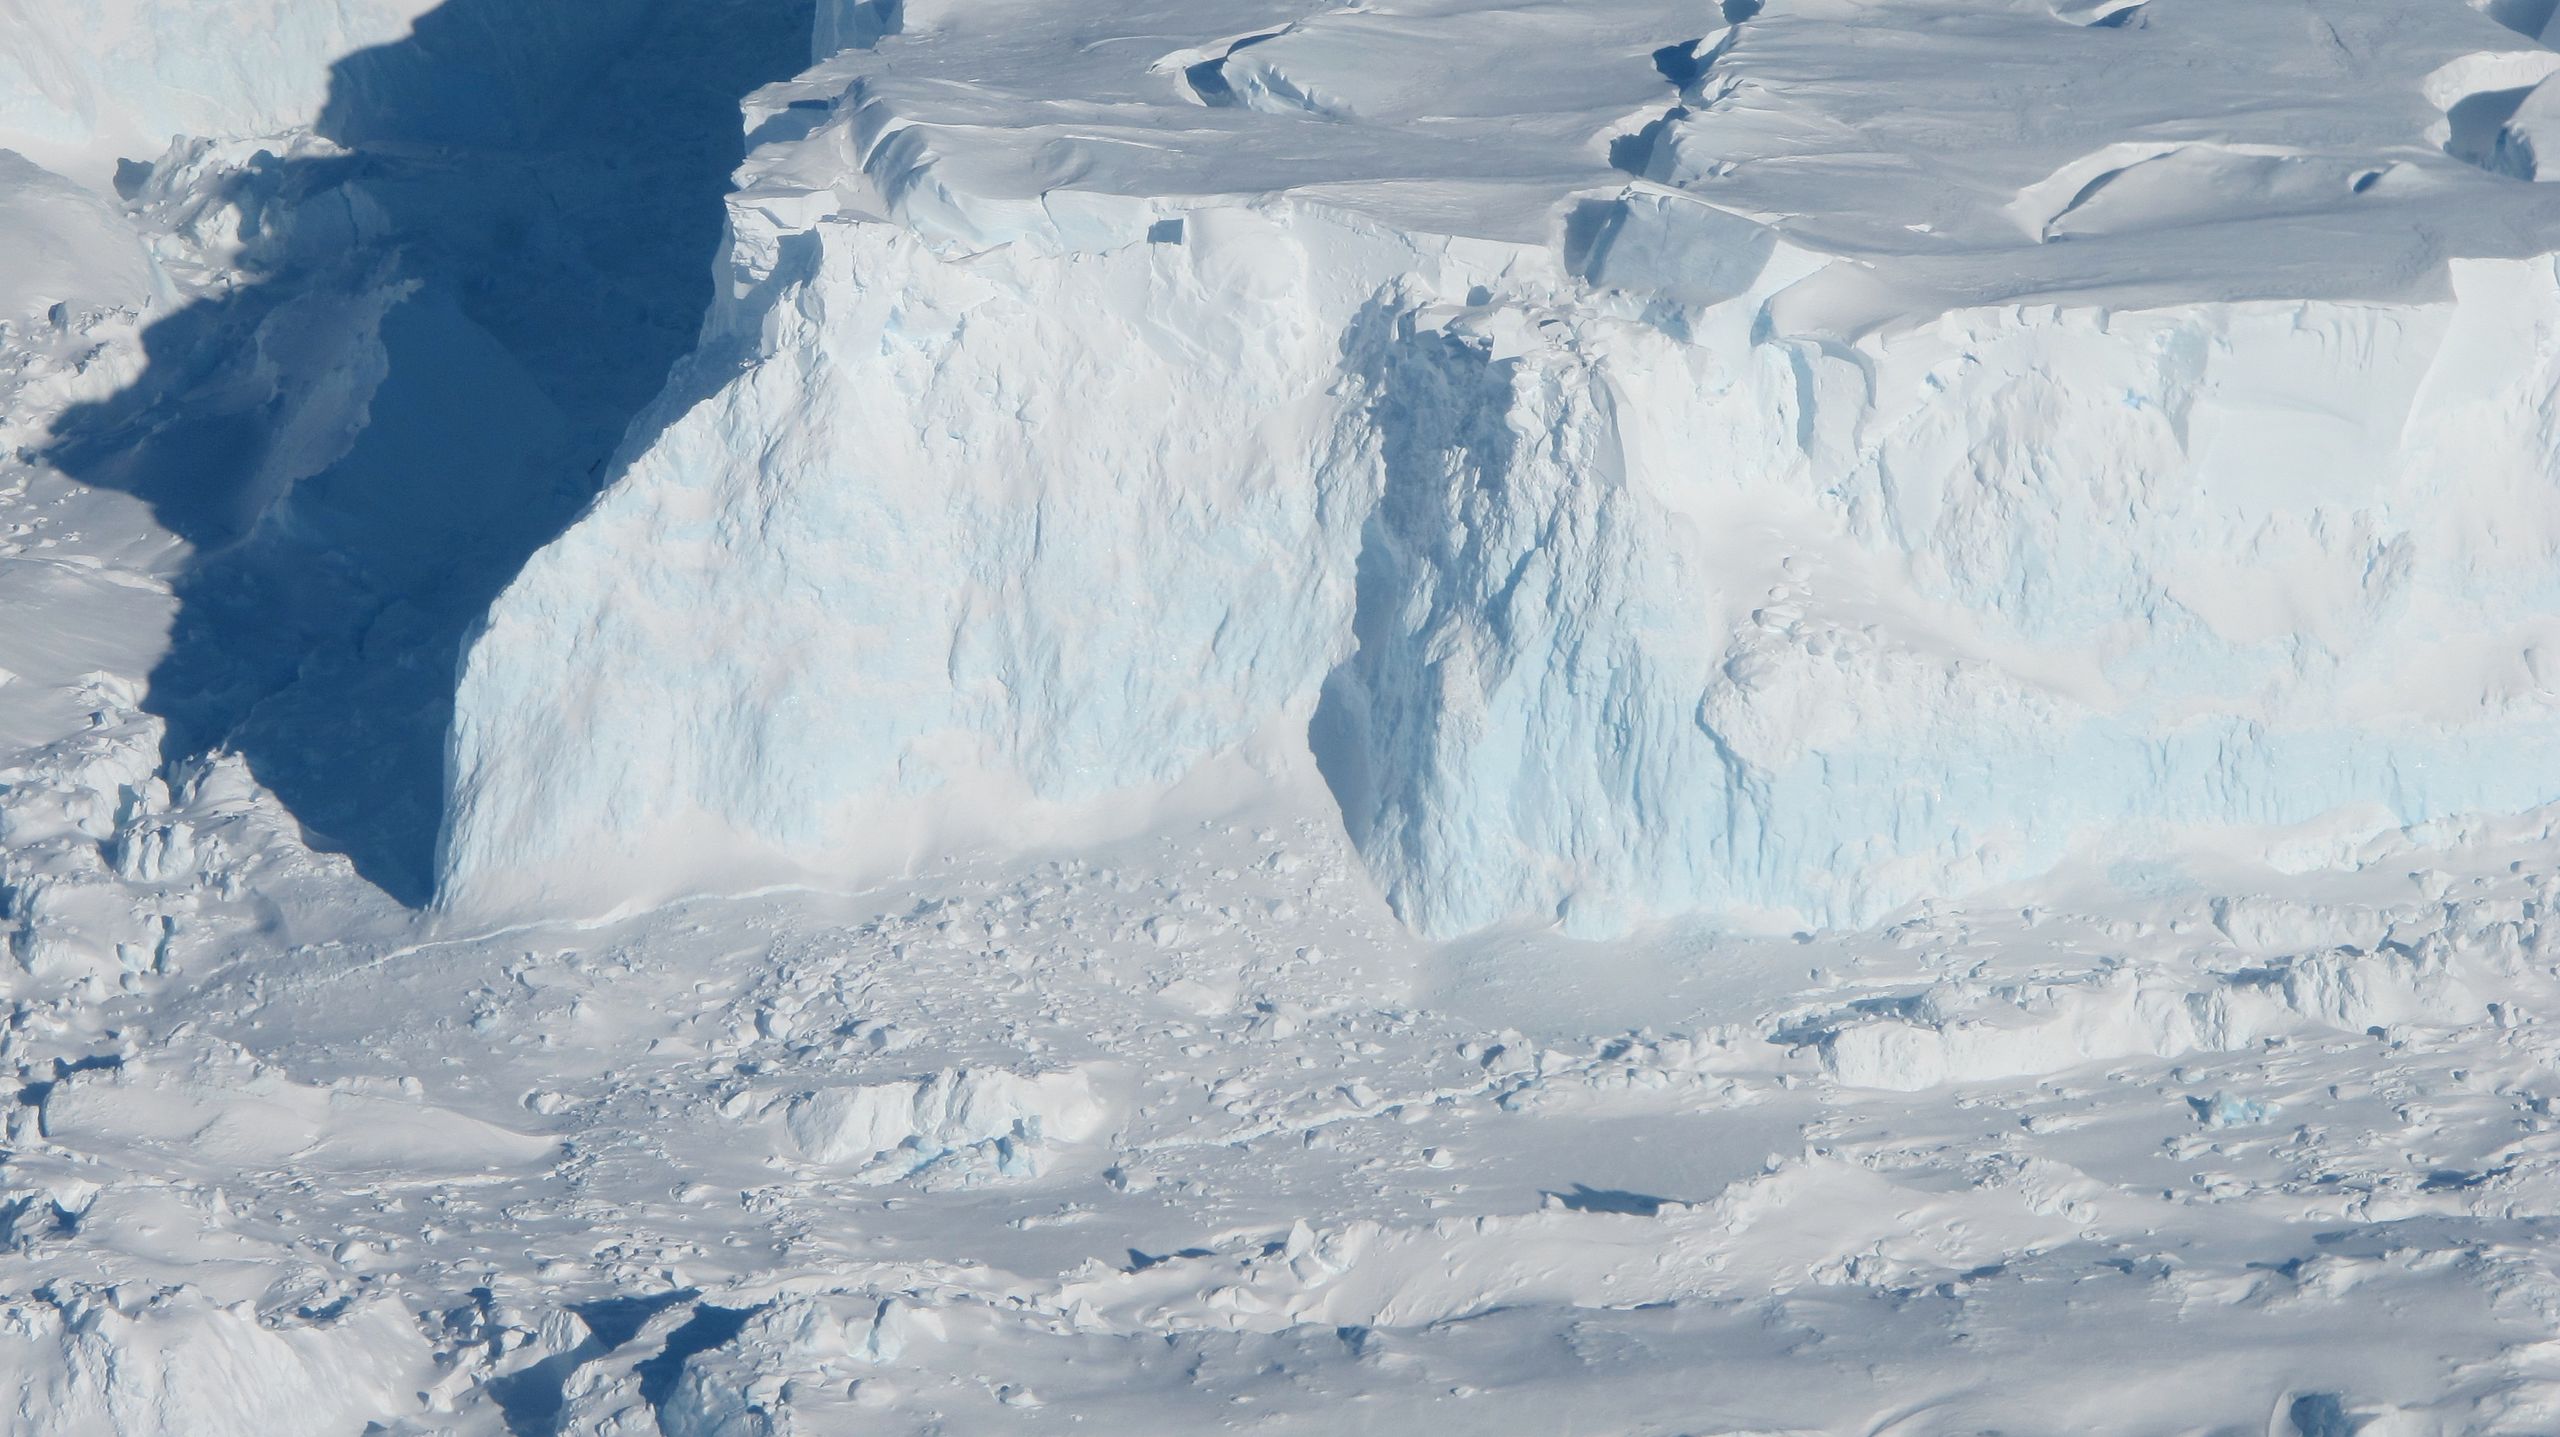
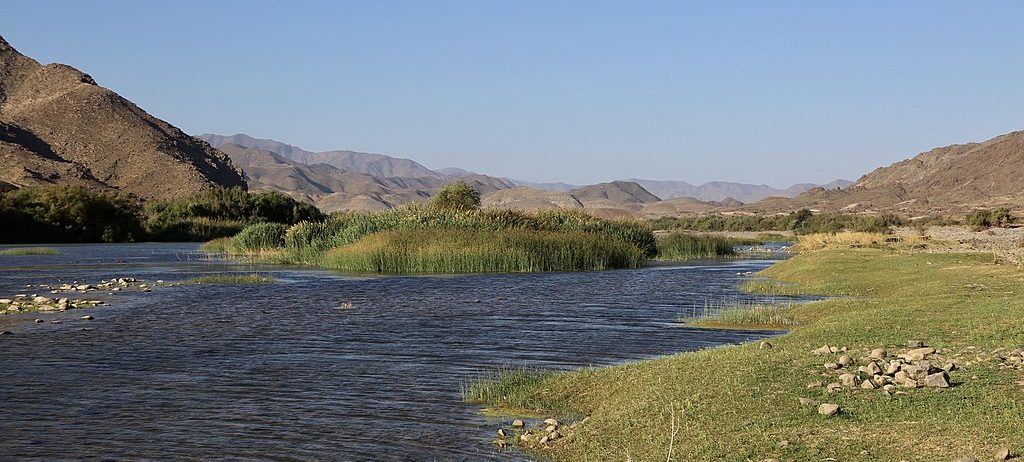
Top picture: Oranje river by yakovlev.alexey, CC BY-SA 2.0 https://creativecommons.org/licenses/by-sa/2.0, via Wikimedia Commons