Glacier changes in the Lingtren–Khumbutse catchment using Pléiades
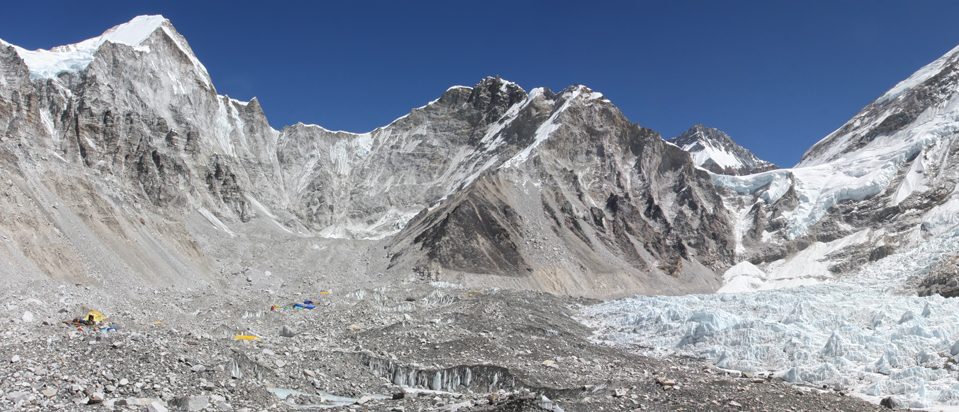
The iconic Khumbu Glacier in Nepal is fed by several tributaries, such as this branch in the Lingtren–Khumbutse catchment.

Recently a new Pléiades triplet covering the Khumbu region was added into the DINAMIS repository (acquisition date 22 Oct 2023). There is another triplet in the same area acquired on 11 Mar 2016 hence we can compute a sequence of two high resolution 3D models that are 7.5 years apart. Welcome to the fourth dimension!
The Lingtren-Khumbutse branch of the Khumbu glacier is less spectacular than the main branch because it is almost entirely covered by granitic debris [1]. However it flows like any glacier as shown by this animation of the shaded relief.
I computed the horizontal displacement from theses shaded DEM images using imGraft [2]. The displacement field looks consistent in the debris covered area, but it is very noisy and heterogeneous on the main branch. The algorithm did not work better with the ortho-images due to the changes in snow cover, illumination, etc.

From both 3D models we can also examine the surface elevation changes in the past 7.5 years.

Pléiades data show that in the Lingtren–Khumbutse catchment, the horizontal velocities range between 5 to 10 meters per year, which is consistent with the data from the global ice velocity atlas computed over 2017-2018 by Millan et al. [3]. The elevation changes of about 2 meters per year are also consistent with the global assessment of glacier thickness changes by Hugonnet et al. over 2015-2019 [4]. The thinning rates in this part of the glacier are less important than those that can be observed in the main part because the debris insulates the ice from the warming atmosphere.

I generated the digital elevation models from each Pléiades triplet in my web browser using the DSM-OPT online service, a very convenient tool to avoid downloading tens of gigabytes of raw imagery on my laptop. There remain some artifacts in the southern face of Lingtren slopes due to data gaps in the DEMs. Steep slopes are always challenging to resolve using satellite photogrammetry. Yet, the DEMs are fairly complete thanks to the tri-stereoscopic acquisition geometry and the good performance of the processing software (MicMac).
DINAMIS services and data are accessible to French public entities and non-profit organizations. Foreign scientists may download DINAMIS products free of charge under specific terms and conditions. See https://dinamis.data-terra.org/en/eligible-users/
References
[1] Higuchi, K., Watanabe, O., Fushimi, H., Takenaka, S., Nagoshi, A., Williams, R. S., & Ferrigno, J. G. (n.d.). GLACIERS OF NEPAL—Glacier Distribution in the Nepal Himalaya with Comparisons to the Karakoram Range. https://pubs.usgs.gov/pp/p1386f/pdf/F6_Nepal.pdf
[2] Aslak Grinsted (2023). ImGRAFT (https://github.com/grinsted/ImGRAFT), GitHub. Retrieved November 12, 2023.
[3] Millan, R., Mouginot, J., Rabatel, A., & Morlighem, M. (2022). Ice velocity and thickness of the world’s glaciers. Nature Geoscience, 15(2), Article 2. https://doi.org/10.1038/s41561-021-00885-z
[4] Hugonnet, R., McNabb, R., Berthier, E., Menounos, B., Nuth, C., Girod, L., Farinotti, D., Huss, M., Dussaillant, I., Brun, F., & Kääb, A. (2021). Accelerated global glacier mass loss in the early twenty-first century. Nature, 592(7856), Article 7856. https://doi.org/10.1038/s41586-021-03436-z
Top picture by Tom Simcock, CC BY-SA 3.0, https://commons.wikimedia.org/w/index.php?curid=19343077