Sentinel-2 + OpenStreetMap = ♡
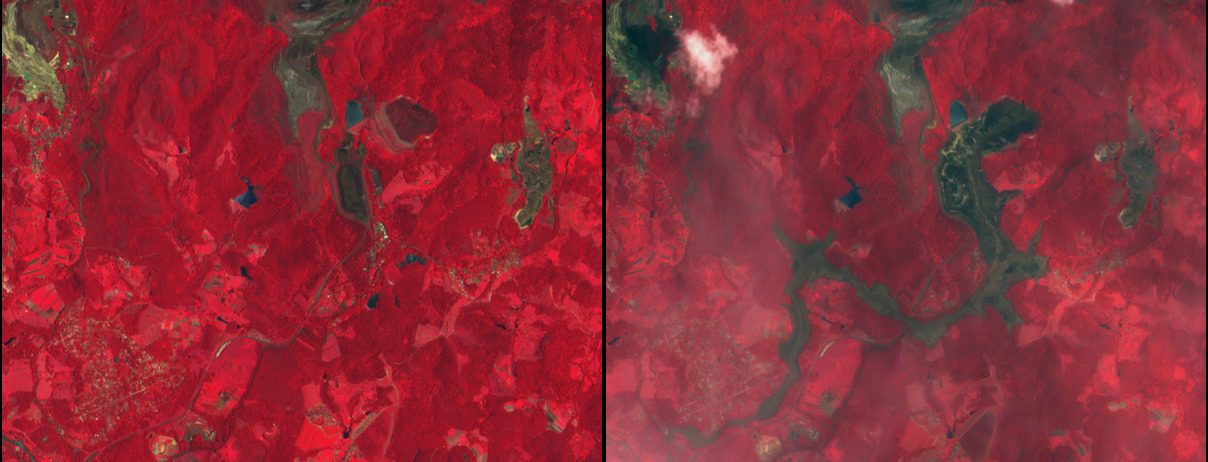
You may have heard about the tailings dam collapse at Feijão mine in Brumadinho, Brazil. The disaster occurred two days ago on Jan 25 and at least 58 people were found dead, while 300 are still missing. A Sentinel-2 acquisition was planned for today, therefore tonight I checked the EO Browser to see if the mud flow was visible.
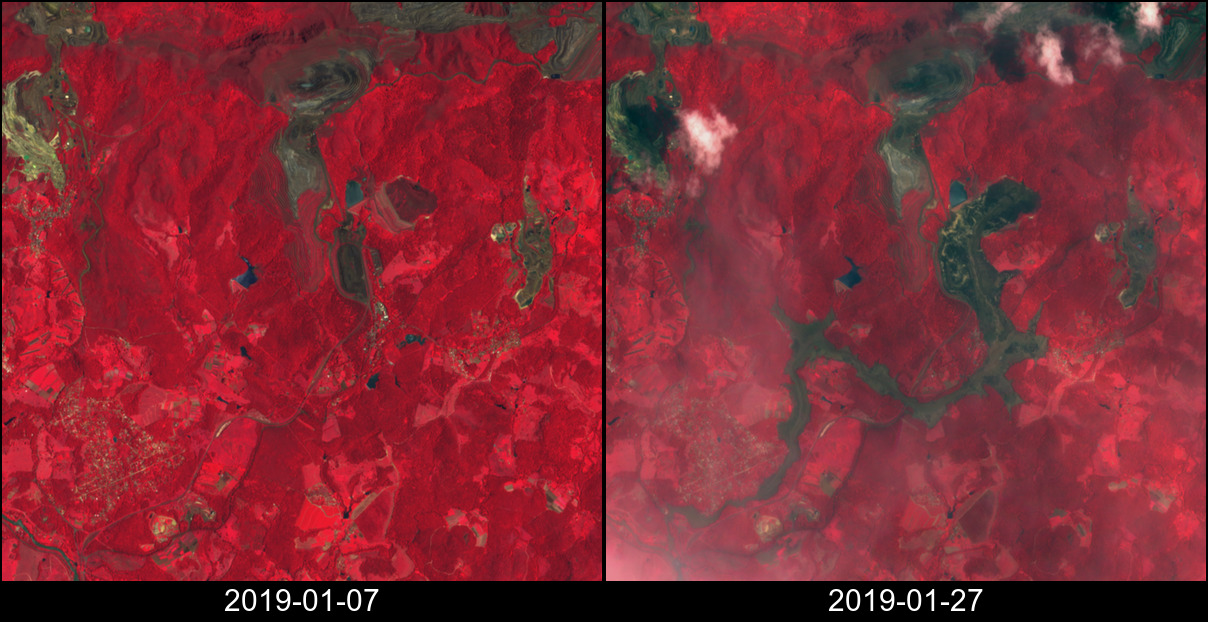
Bingo! I just needed to tinker a bit with QGIS to get an independent estimate of the mudflow area… From the EO Browser I downloaded the near-infrared band of the two above images, because the near-infrared band makes it easy to distinguish the vegetation from other surfaces and I computed the normalized difference: (Before-After)/(Before+After).
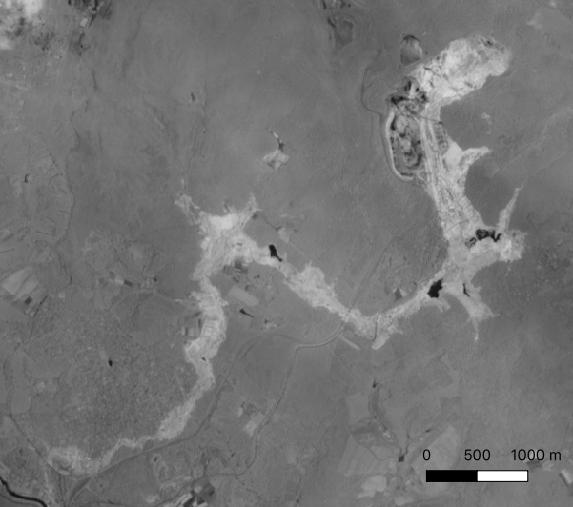
I converted this grayscale image to a binary image using a threshold of 0.2, vectorized the result and manually edited the polygon especially in the lower part of the deposit where a thin cloud cover dampens the contrast between both images. Then I displayed the polygon over the Openstreetmap layer… This is when I noticed that the mudflow deposit was already present in Openstreetmap!
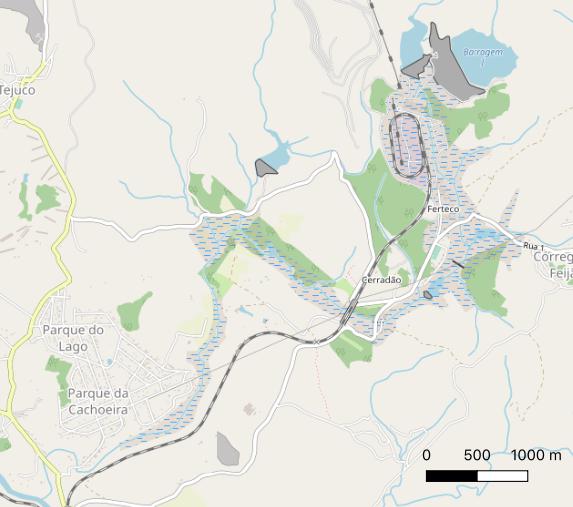
Using the QuickOSM plugin for QGIS, I downloaded the OSM vector data and extracted the « mudflow » polygon. Its attribute table indicates: « source:image: Sentinel Satellite S2-L1C 2019-01-27 at sentinel-hub.com ». Its area is 2.9778 sq. km. My polygon has an area of 2.9585 sq. km.
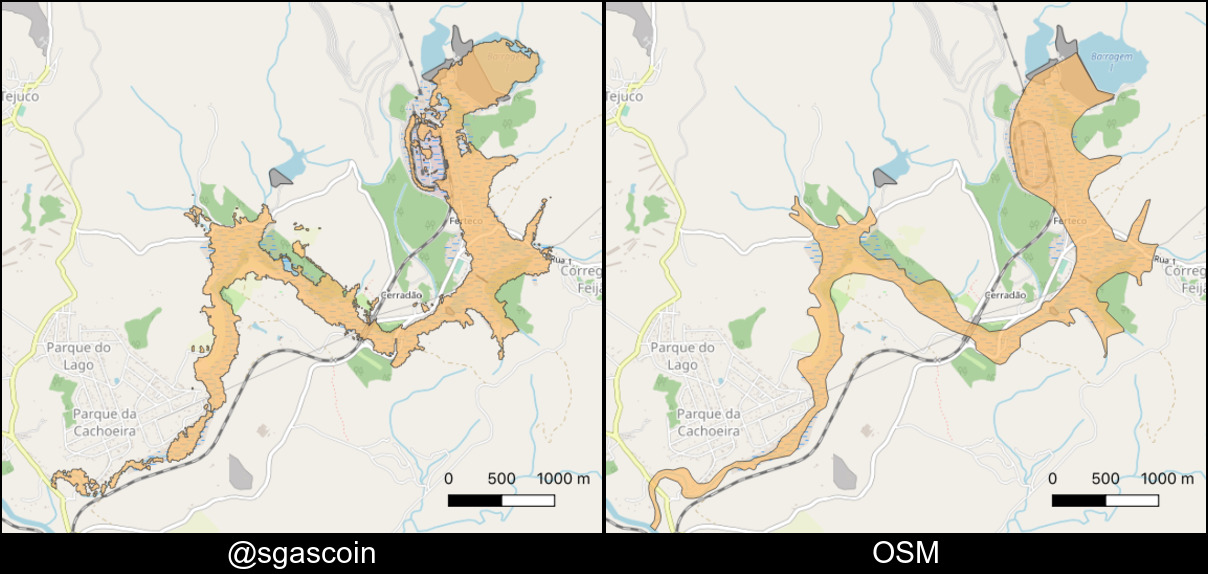
It means that someone, somewhere, has updated OSM using today’s Sentinel-2 image… That’s an impressive example of how open data like Sentinel-2/Copernicus data can serve collaborative projects and emergency mapping.
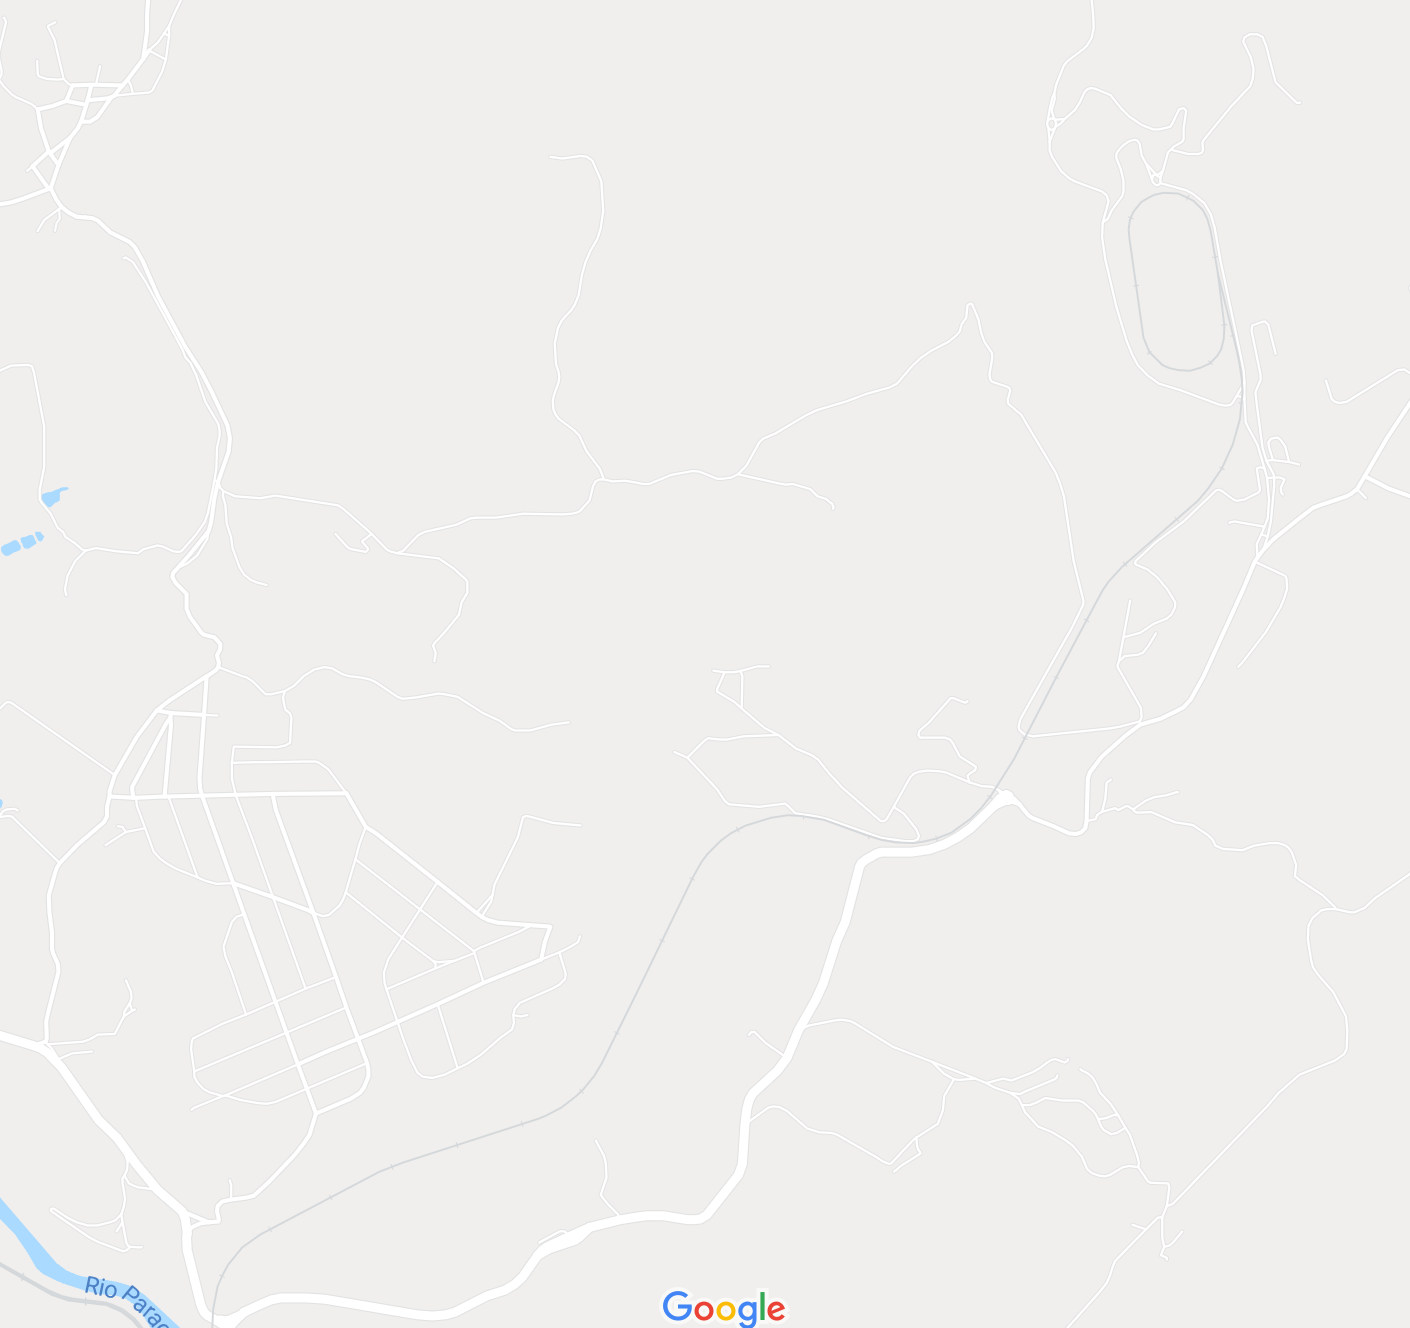
Oh by the way! This is how it looks in Google Maps: