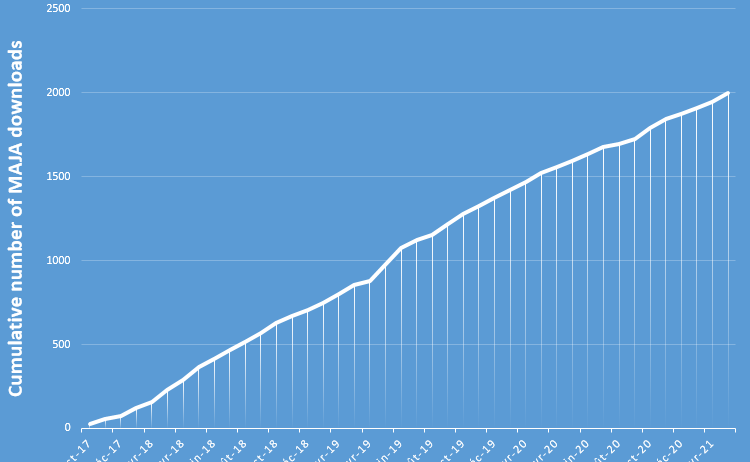
2 000 downloads for MAJA !

The distribution of MAJA L2A processor, as an  executable software, started in april 1997, but we started counting the number of downloads only since October 2017. The cumulative number of downloads just reached 2000 on April the 2nd 2021. It is on average 1.56 downloads per day, and more than 2 downloads per work day !

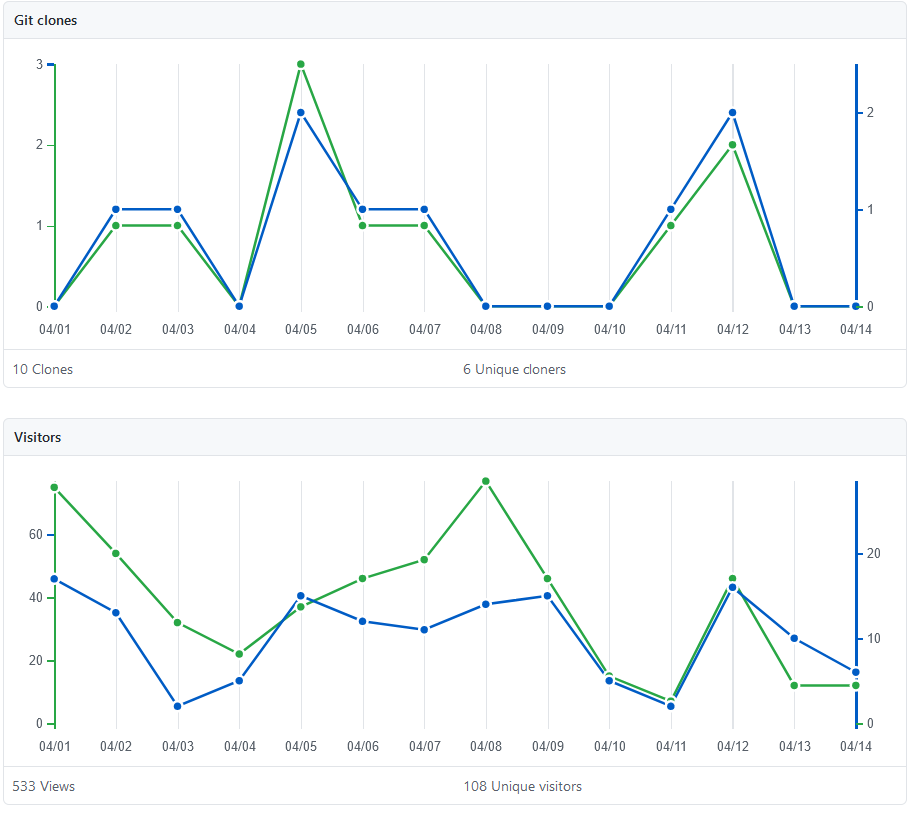
Since October 2020, MAJA became an open source software distributed on github. Github does not count the downloads, and only provides the number of clones made by different users in the last 2 weeks. The plot below shows that we have to add 3 clones per week to the downloads of the executable version. As the github site also serves as MAJA’s forum so far, you can also see the traffic on the documentation pages and forum in the plot provided below.

MAJA is not a simple software that runs on a laptop. It is designed to work only on linux platforms, and the Sentinel-2 data require a large disk space, and a comfortable memory. We tehrefore did not expect it would reach such a large amount of downloads. If you are one of MAJA users, we would be pleased to hear about the aplications for which you used MAJA.

MAJA clones (top) and information traffic (bottom) on github

Plus d'actualités

BIOMASS, the third launched satellite mission designed at CESBIO !

After SMOS in 2009, and VENµS in 2017, the CESBIO Laboratory is very proud to see its third proposed mission, Biomass, reach orbit. As always, it has been a long journey from the idea, at the beginning of the century, to the selection in 2013 as the seventh Earth Explorer Mission by ESA, to the […]

Sentinel-2 reveals the surface deformation after the 2025 Myanmar earthquake

Sentinel-2 captured several clear-sky images of Myanmar before and after the 28 March 2025 earthquake. The animation below shows a 5-day apart sequence of images captured by Sentinel-2B and Sentinel-2C (10 m resolution) near the epicenter located close to Mandalay. The surface slip due to the earthquake follows the Sagaing Fault, a major fault in […]

Evolution de l’altitude de la ligne de neige au cours des 41 dernières années dans le bassin versant du Vénéon (Oisans)

Pour contribuer à caractériser les conditions hydrométéorologiques lors de la crue torrentielle qui a frappé la Bérarde en juin, j’ai analysé une nouvelle série de cartes d’enneigement qui couvre la période 1984-2024 [1]. Grâce à la profondeur temporelle de cette série, on constate que l’altitude de la ligne de neige dans le bassin versant du […]

Rechercher