Visualizing the vegetation dynamics in Africa

The Global Imagery Browse Services is an API provided by the NASA to access its vast collection of Earth Observation products.

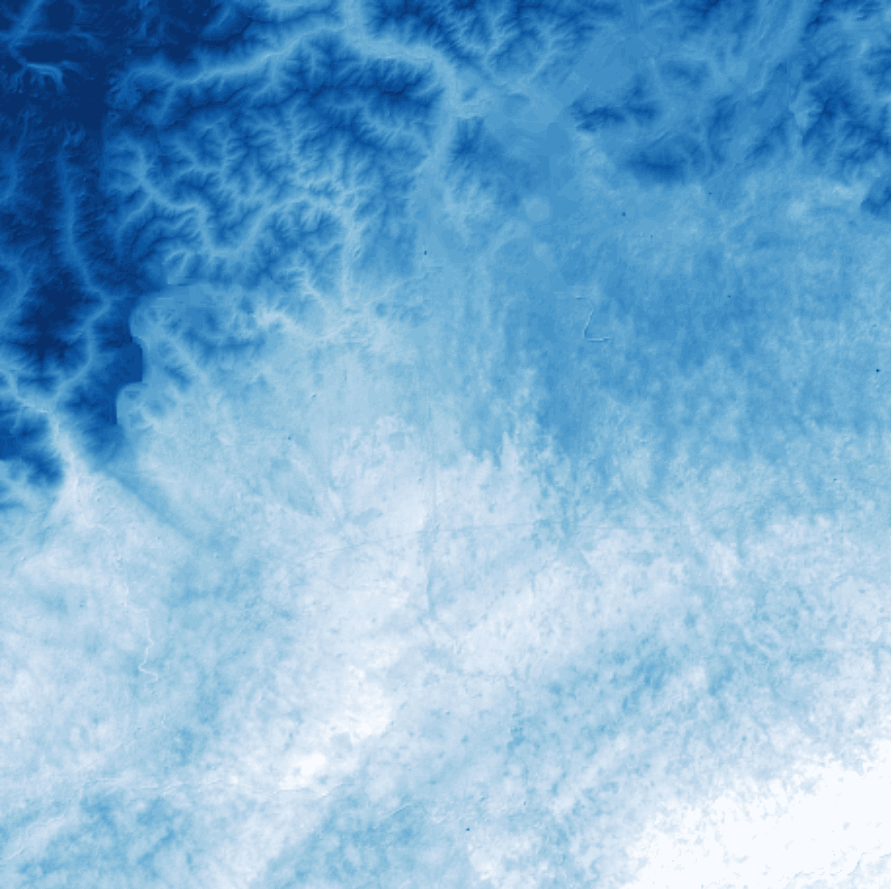
It’s convenient to use the Worldview online data browser to get the right URL template. Just click on « Take a snapshot » and copy the URL. For example the following URL allows you to download a jpeg picture of the Terra MODIS NDVI in December 2002 over Africa:

https://wvs.earthdata.nasa.gov/api/v1/snapshot?REQUEST=GetSnapshot&TIME=2002-12-01T00:00:00Z&BBOX=-36.03751831054688,-18.663024902343757,37.77621459960939,52.163305664062506&CRS=EPSG:4326&LAYERS=Coastlines,MODIS_Terra_L3_NDVI_Monthly&WRAP=x,day&FORMAT=image/jpeg&WIDTH=806&HEIGHT=840

By looping on the « TIME » parameter (in a bash script using wget) you can get every monthly products from 2001 to 2020, and make this animation ( using ffmpeg). The « & » symbol in the end of the line sends the download requests in parallel (don’t abuse of it).

for yy in $(seq 2001 2020)
do
  for mm in 01 02 03 04 05 06 07 08 09 10 11 12
  do
   wget "https://wvs.earthdata.nasa.gov/api/v1/snapshot?REQUEST=GetSnapshot&BBOX=-36.03751831054688,-18.663024902343757,37.77621459960939,52.163305664062506&CRS=EPSG:4326&LAYERS=Coastlines,MODIS_Terra_L3_NDVI_Monthly&WRAP=x,day&FORMAT=image/jpeg&WIDTH=806&HEIGHT=840&TIME=$yy-$mm-01T00:00:00Z" -O $yy-$mm.jpg &
  done
done


You can also download the images as Geotiff if you wish to combine them with other geospatial data.

Each layer comes with a specific colormap that is consistent with the product. In addition you can download a stack of multiple layers with different opacities, for example you can overlay the MODIS « fire » layer on the « NDVI » layer.

https://wvs.earthdata.nasa.gov/api/v1/snapshot?REQUEST=GetSnapshot&TIME=2002-12-01T00:00:00Z&BBOX=-36.03751831054688,-18.663024902343757,37.77621459960939,52.163305664062506&CRS=EPSG:4326&LAYERS=Coastlines,MODIS_Terra_L3_NDVI_Monthly,MODIS_Terra_Thermal_Anomalies_All&WRAP=x,day,none&FORMAT=image/jpeg&WIDTH=806&HEIGHT=840&ts=1611574112018

Note: this article was updated on 25 Jan 2021.


Plus d'actualités

BIOMASS, the third launched satellite mission designed at CESBIO !

After SMOS in 2009, and VENµS in 2017, the CESBIO Laboratory is very proud to see its third proposed mission, Biomass, reach orbit. As always, it has been a long journey from the idea, at the beginning of the century, to the selection in 2013 as the seventh Earth Explorer Mission by ESA, to the […]

Biophysical parameter retrieval from Sentinel-2 images using physics-driven deep learning for PROSAIL inversion

The results presented here are based on published work: Y. Zérah, S. Valero, and J. Inglada. « Physics-constrained deep learning for biophysical parameter retrieval from sentinel-2 images: Inversion of the prosail model« , in Remote Sensing of Environment, doi: 10.1016/j.rse.2024.114309. This work is part of the PhD of Yoël Zérah, supervised by Jordi Inglada and Silvia Valero. […]

Nouvel article : peu d’apport des images Sentinel-1 pour le suivi du dépérissement des chênes et châtaigniers

Dans le cadre du projet SuFoSat mené au CESBIO, une collaboration entre trois laboratoires (CESBIO, Dynafor et P2PE) a permis d’évaluer l’apport des images Sentinel-1 pour la détection précoce du dépérissement sur deux essences de feuillus : les chênes et les châtaigniers sur une vaste zone (12 tuiles Sentinel-2, voir Figure 1). Des classifications ont été […]

Rechercher