Vavilov Glacier in 2016 and 2017

The organizers of the 2017 International Glaciology Society meeting in Boulder tweeted this animation of the Vavilov Glacier (October Revolution Island, Russian Arctic):

I tweeted a similar animation using only Sentinel-2 imagery for the years 2016 and 2017:


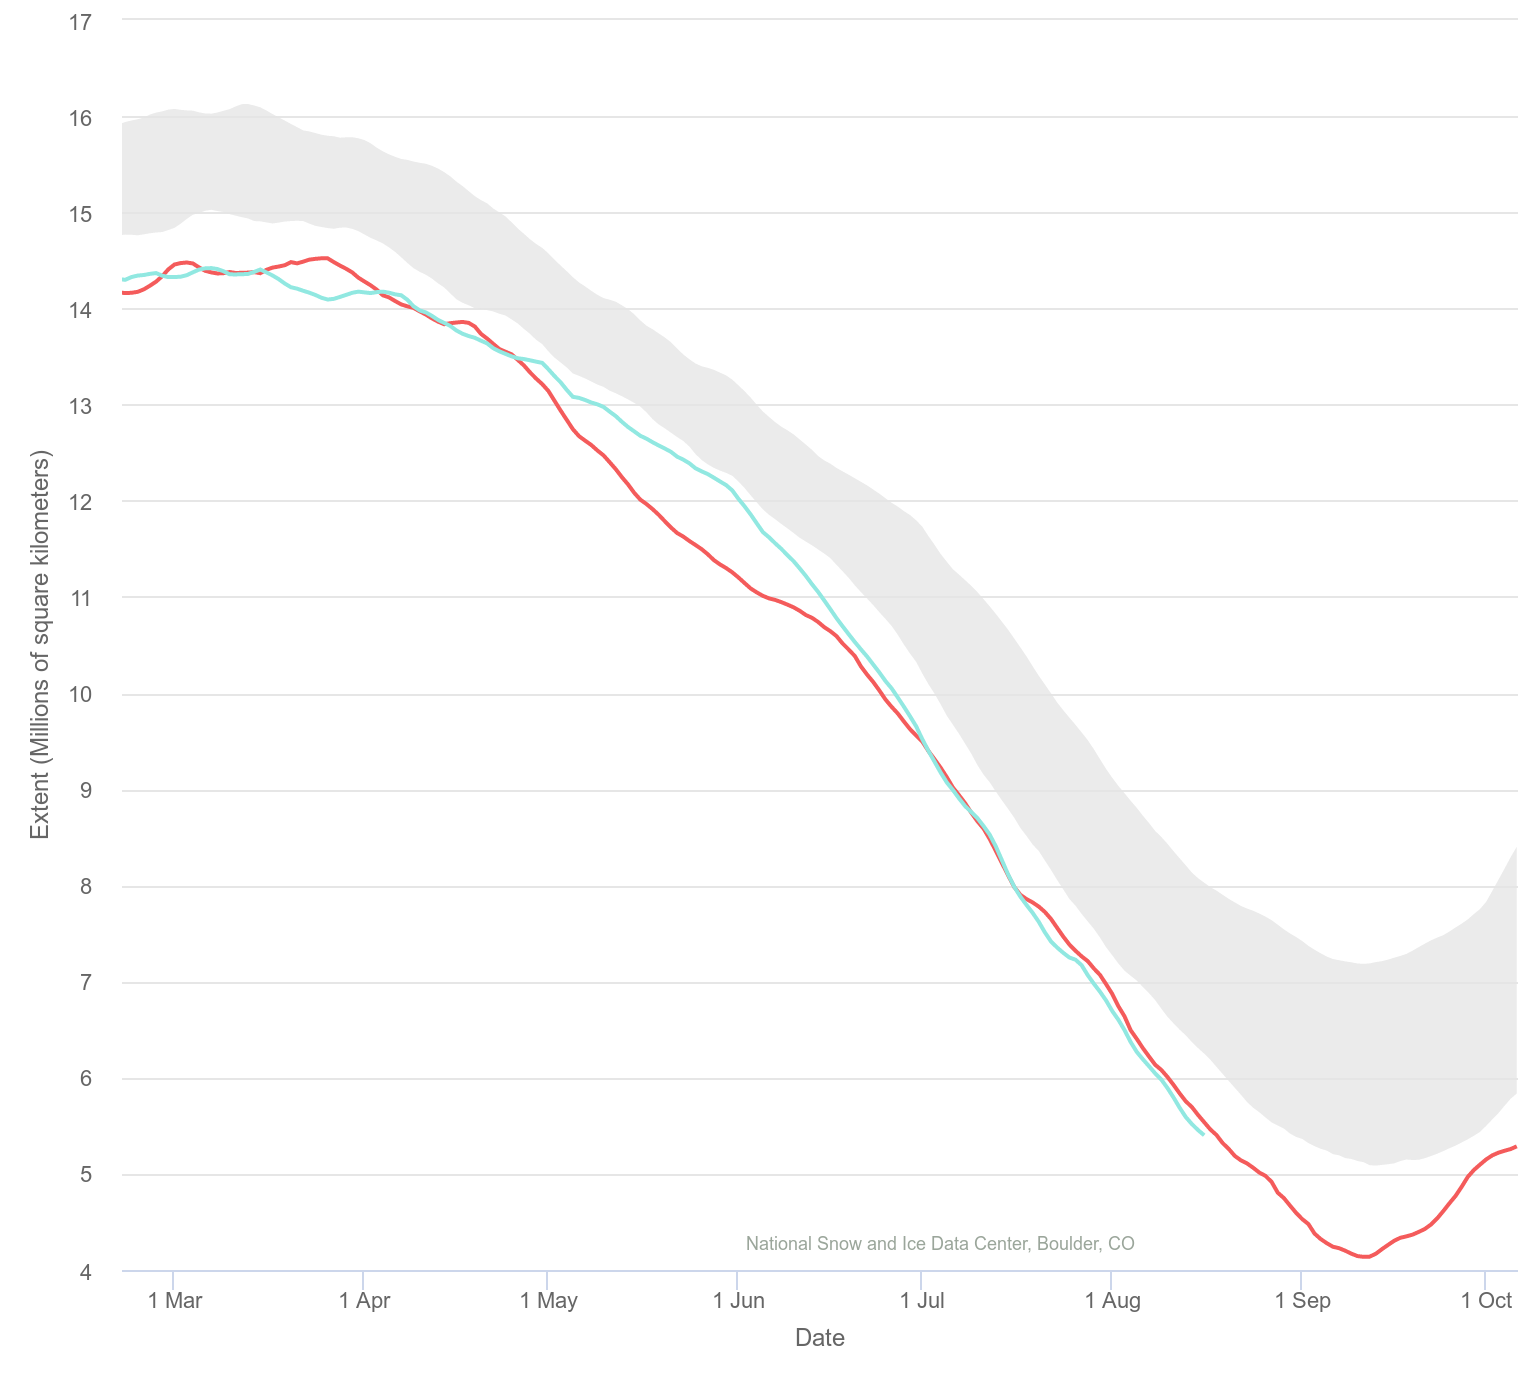
Of course the Sentinel-2 record is too short to say anything about the long term evolution of the glacier. However we can spot some differences between both years. In August 2017 the glacier front is still more advanced than it was last year in July. Also, in 2016 the sea ice started to unlock the glacier tongue earlier than it did in 2017. This is consistent with the fact that in May-June 2016, Arctic sea ice reached a record low. It can be seen using the interactive sea ice graph that the Arctic sea ice extent in 2017 was not as low as it was in 2016:

Arctic sea ice extent in 2016 (red) and 2017 (blue). The shaded area is the 1981-2010 interdecile range.

I wonder if the rapid ablation of the Vavilov glacier front in 2016 is related to the early ice free conditions!

edit on Sep 2018: Sentinel-1 animation

Plus d'actualités

BIOMASS, the third launched satellite mission designed at CESBIO !

After SMOS in 2009, and VENµS in 2017, the CESBIO Laboratory is very proud to see its third proposed mission, Biomass, reach orbit. As always, it has been a long journey from the idea, at the beginning of the century, to the selection in 2013 as the seventh Earth Explorer Mission by ESA, to the […]

Sentinel-2 reveals the surface deformation after the 2025 Myanmar earthquake

Sentinel-2 captured several clear-sky images of Myanmar before and after the 28 March 2025 earthquake. The animation below shows a 5-day apart sequence of images captured by Sentinel-2B and Sentinel-2C (10 m resolution) near the epicenter located close to Mandalay. The surface slip due to the earthquake follows the Sagaing Fault, a major fault in […]

Evolution de l’altitude de la ligne de neige au cours des 41 dernières années dans le bassin versant du Vénéon (Oisans)

Pour contribuer à caractériser les conditions hydrométéorologiques lors de la crue torrentielle qui a frappé la Bérarde en juin, j’ai analysé une nouvelle série de cartes d’enneigement qui couvre la période 1984-2024 [1]. Grâce à la profondeur temporelle de cette série, on constate que l’altitude de la ligne de neige dans le bassin versant du […]

Rechercher