
Using High Spatial Resolution Time Series to monitor forage production
 =>
=> 
An index-based insurance solution is developed to estimate and monitor the near real-time forage production in France. In this system, payouts are indexed on an indicator, called Forage Production Index (FPI), calculated using a biophysical characterization of the grassland from medium spatial resolution remote sensing time series.
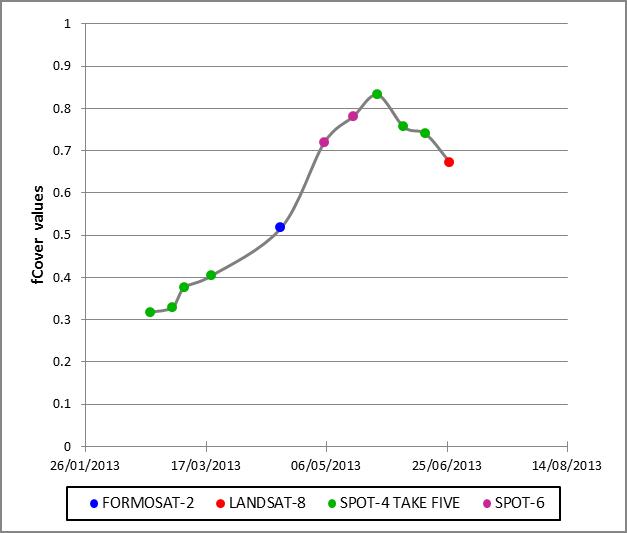
We used the fCover integral as a surrogate of the forage production. fCover is a biophysical parameter that estimates the fraction of ground covered by green vegetation, looking in a vertical direction, independently of the actual image sensor viewing or illuminations conditions. The first step of the validation process is to compare local ground measurements of biomass production and FPI values obtained from high spatial resolution space-based images. A field protocol (from PV PROTIN, 2010. ARVALIS –Arvalis, Institut du Végétal) was applied to 6 plots of grassland located in the area of Toulouse. These plots were selected to represent variations on pasture management practices and to consider different types of grassland species (Table 1). From March, 7th to June, 17th 2013, biomass was measured every 15 days using a sickle bar mower with a 110 cm cutter bar. Finally, the dataset contains 320 plots. It corresponds to one production data per hectare per plot every two weeks in average.
| Name | Cover | Surface (ha) | Pasture management practice | Images used |
| Parcel 1 | Alfalfa | 7,3 | Hay | Take 5 : 6 / Spot 6 : 2 / Landsat 8 : 1 |
| Parcel 2 | Natural grassland | 9,4 | Hay | Take 5 : 4 / Spot 6 : 1 / Landsat 8 : 1 / Formosat2 : 4 |
| Parcel 3 | Ray-Grass | 8,6 | Silage in May / Hay in June | Take 5 : 5 / Spot 6 : 3 / Landsat 8 : 1 |
| Parcel 4 | Natural grassland | 6,0 | Hay | Take 5 : 7/ Spot 6 : 2 / Landsat 8 : 1 / Formosat2 : 1 |
| Parcel 5 | Fescue/ Orchard grass / White clover | 11,5 | Hay then pasture | Take 5 : 5 / Spot 6 : 2 / Landsat 8 : 2 / Formosat2 : 1 |
| Parcel 6 | Fescue/ Orchard grass | 6,8 | Hay | Take 5 : 3 / Spot 6 : 2 / Landsat 8 : 1 / Formosat2 : 1 |
Table1 : Characteristics of the 6 parcels
The 6 plots are in the SudMipy area defined in the framework of SPOT4 -Take5 project. So we used SPOT4 images acquired in the context of this program to build a high spatial resolution time series. Due to the climatic conditions during spring 2013, we had to complete the dataset with images from other sensors Landsat-8, SPOT-6 and Formosat-2. Finally, from February, 16th to June, 26th 2013, we have one image every 15 days over the 6 parcels (Table 1).Figure 1 presents the fCover mean profile for parcel 4 and derived from remote sensing images of multiple sensors. Figure 2 presents the relation between the biomass measured on the ground and estimated from remote sensing images time series. For the whole dataset, the scatter plot between FPI and ground biomass shows an acceptable correlation (R²=0,724; α < 0,0001). However, it remains a substantial dispersion with a RMSE going up to 0.128.
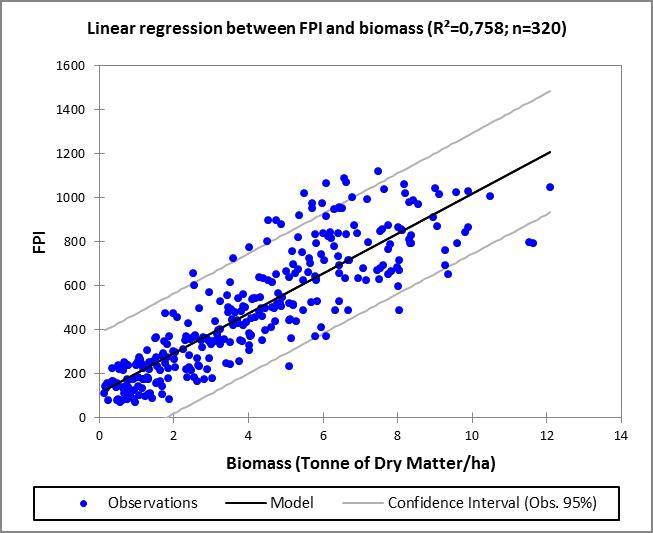
If we take into account only data recorded during the growing period, the results are improved (R2= 0,811; α < 0,0001 and RMSE 0,101). This can be explained by the way FPI is designed: by definition, when the fCover integral is calculated, the brown fraction of the cover is not considered. In the framework of the research activities developed to create the index-based insurance product, these results enable to conclude that High Spatial Resolution images can be used to perform an indirect validation of the FPI produced from medium spatial resolution remote sensing time series. Anne JacquinAntoine RoumiguiéUniversité de Toulouse, Institut National Polytechnique de Toulouse, Ecole d’Ingénieurs de Purpan, UMR 1201 DYNAFOR, France.

