
SPOT4 (Take5) surface reflectance validation using CNES ROSAS station in la Crau.
 =>
=>  More than 10 years ago, on the Crau plain, in Provence, CNES set up an automatic calibration station to measure the atmospheric optical properties and the surface reflectances. This station, named ROSAS (RObotic Station for Atmosphere and Surface), is at the top of a 10 meter mast, and is equipped with a CIMEL instrument similar to the ones of the AERONET network that are used to characterize the atmospheric aerosols. But this one has been modified to observe also the ground. The initial objective of this station was to check the absolute calibration of optical remote sensing instruments with a high resolution (because the site uniformity is not sufficient for satellites with a kilometric resolution). But this station proves also useful to validate the surface reflectances from satellite level 2A products. This work was done by some CNES colleagues, Vincent Lonjou, Sébastien Marcq et Aimé Meygret, using the level 2A products obtained from SPOT4 (Take5) experiment.The ROSAS station needs 90 minutes to fully characterize the downward radiance and thus the atmosphere, and the upward radiance. The ratio of both measurements enable to compute the surface reflectance. However, the process is a little more complex than described here, as the surface around the mast is not perfectly uniform and the reflectances are affected by directional effects. A bidirectional model is therefore fitted to the measurements, and this model is then used to predict the reflectances measured by the satellite.
The ROSAS instrument, during the SPOT4 (Take5) experiment, was equipped with 10 spectral bands described in the table below. The instrument is now being modified in view of Sentinel-2 and Venµs launches, to accommodate new spectral bands, in the near infra-red mainly, where the sampling of the spectrum was not sufficient.
| Band | λ (nm), detector |
| 1 | 1020Si |
| 2 | 1600 InGaAs |
| 3 | 870 Si |
| 4 | 670 Si |
| 5 | 440 Si |
| 6 | 550 Si |
| 7 | 1020 InGaAs |
| 8 | 937 Si |
| 9 | 380 Si |
| 10 | 740 Si |
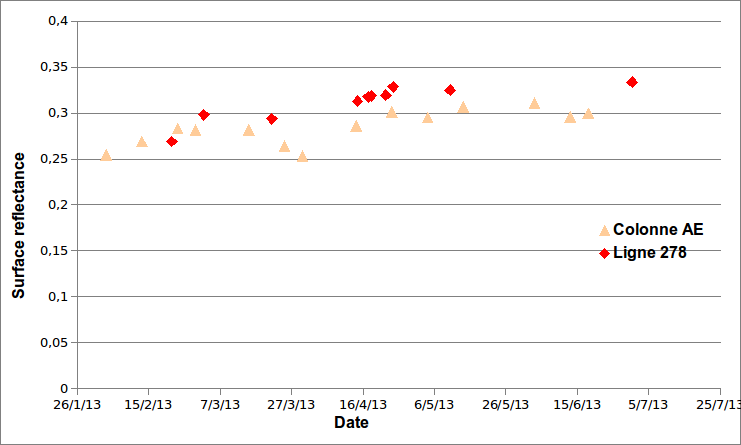
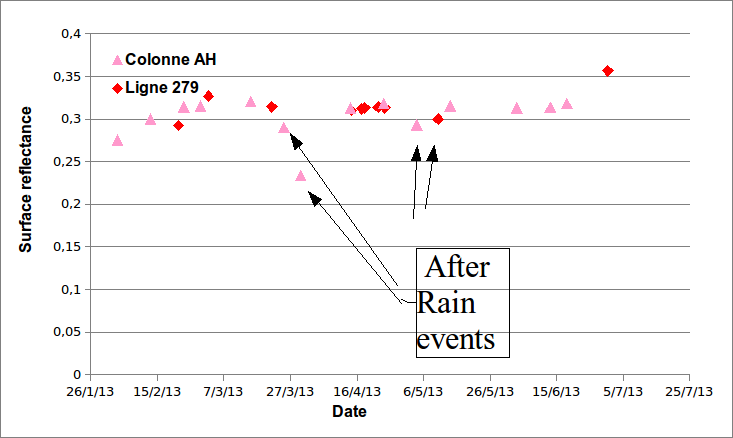
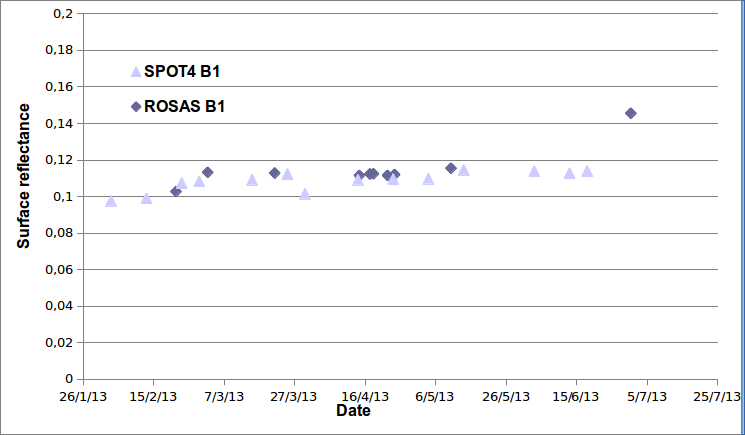
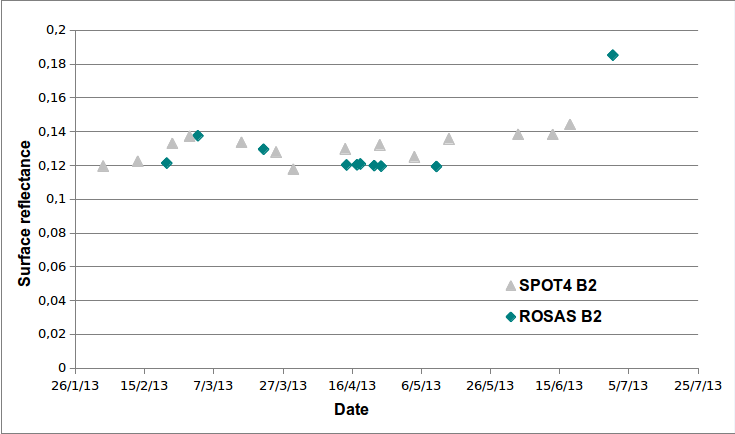
The agreement of ROSAS and SPOT4(Take5) surface reflectance measurement is excellent, in all band but near-infrared : better than 5% in the green (B1), red (B2) and SWIR (B4) channels, and 7-8% in the NIR (B3). The differences observed in the NIR are being investigated, but could be linked to the spectral interpolation, as SPOT4 B3 band is quite far from ROSAS spectral bands.In the SWIR, the greater variations of surface reflectances with time may be noticed, with large reflectance drops after rains. The SWIR band is very sensitive to the soil moisture, at least when the vegetation cover is sparse, which is the case at La Crau. In the other bands, these variations are much less visible, and what should be noticed is the great stability of surface reflectances with time, thanks to the acquisitions with constant viewing angles and also to the quality of atmospheric correction… A poster was shown by Aimé Meygret at the « Sentinel-2 for science » symposium in Frascati in may 2014.

