
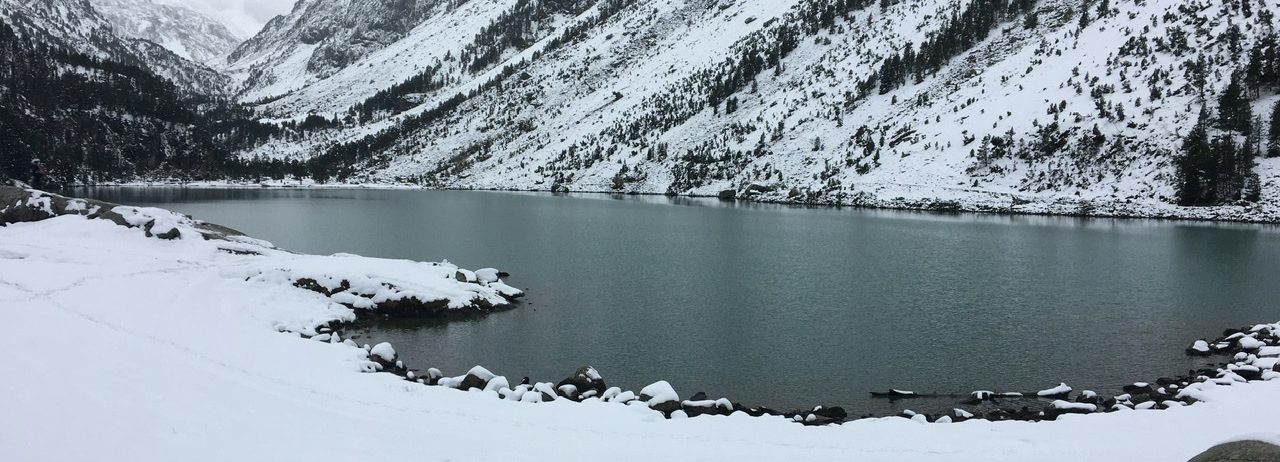
Snow cover duration at lakes in the Pyrenees
In the framework of the Pyrenees Climate Change Observatory (OPCC) the Cesbio is contributing to the analysis of the snow cover using satellite imagery. In 2016 four projects associated with the Observatory (Climpy, Replim, Canopee y Florapyr) have been programmed with European Regional Development Funds for transborder cooperation on adaptation to climate change for the next three years [1].
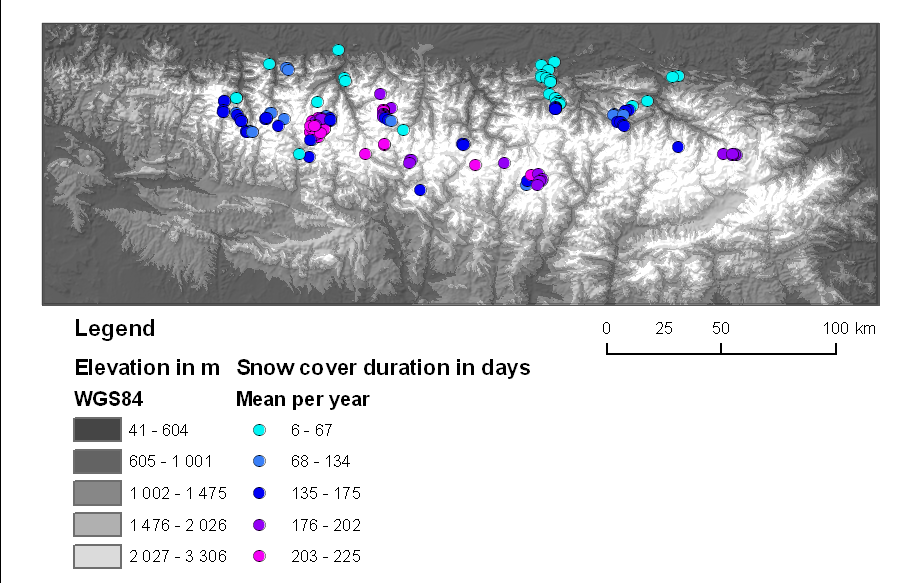
The map below shows a selection of lakes which are being studied as part of the Replim project. If you click on one of the icon, you will see a table which indicates the average snow cover duration (in days) at this location. For example, the field « Year » is the mean number of snow days per hydrological year (01-Sep to 31-Aug) that was observed between 01-Sep-2000 and 31-Aug-2015. The field « Jan » is the mean number of snow days in January over the same period, etc. I made this map using a daily snow cover climatology for the Pyrenees from satellite observations (MODIS snow products, see Gascoin et al. 2015)
You can download the data by expanding the left bar and click on « embed and share this map » then scroll down to « download ». The duration of the snow cover depends on various factors, one of the most important being the elevation. We can check this using the SRTM digital elevation model. Here I resampled the DEM from 90 m to 500 m to match the resolution of the MODIS snow maps.
We can now plot the snow cover duration at each lake against the elevation of the corresponding MODIS pixel.
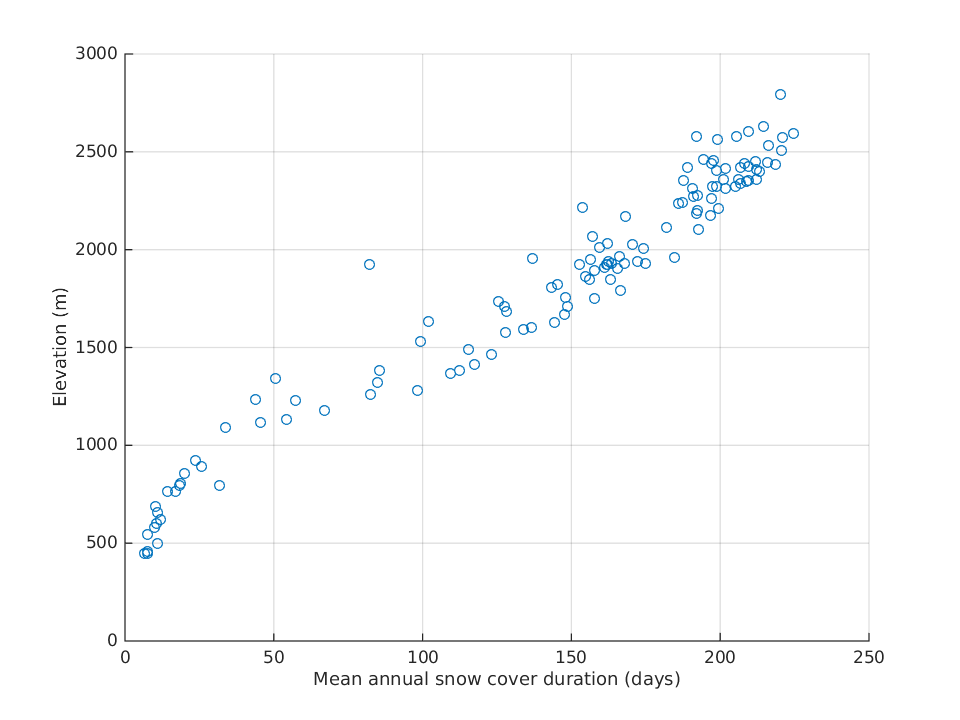
There are many lakes above 2000 m in this dataset. These lakes are important proxies of environmental changes, including climate change, in high elevation regions [3].
Notes
[1] European Funds for the 5 the Pyrenees Observatory
[2] The data are available in Zenodo: Gascoin, Simon. (2016). Cloud-free snow cover area in the Pyrenees from MODIS [Data set]. http://doi.org/10.5281/zenodo.162299

[3] Adrian, Rita, et al. « Lakes as sentinels of climate change. » Limnology and oceanography 54.6 (2009): 2283.

