Sentinel-2 to monitor forest fires in Siberia?
At the beginning of summer, a colleague in Igarka (Maxime Deschuyteneer ?) informed me on 20th of July that a forest fire up to the city was responsible, according to him, of “a small greenhouse effect that make you cough”…Indeed, forest fires are recurring problems in Central Siberia, mainly during June and July because of a sharp increase of temperatures. These fires have widely increased last years and the year 2016 would be the most “blazed” of history since, according to GreenPeace Russia, 3.5 million ha of forests have been burnt1, as big as seven French departments! On 24th September, NASA has also published an Aqua MODIS scene from 18th September 2016 showing huge plumes moving towards North East of Russia as well as zones (in red) where the satellite has detected unusual warm temperatures associated with fire2. The extent of MODIS image on the map of concentrations of aerosols allows presenting the scale of the phenomenon.
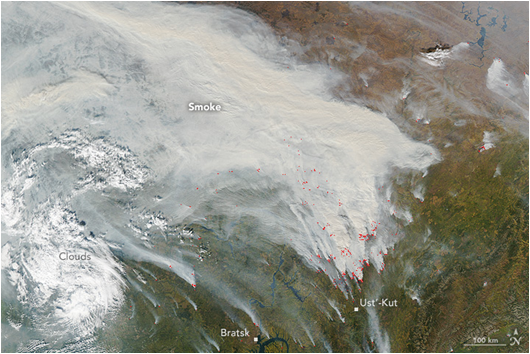
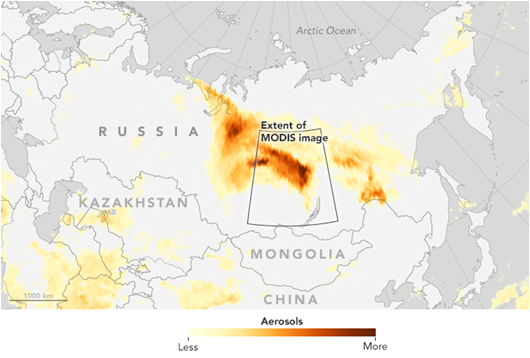
(at the top)- NASA’s Aqua satellite scene (MODIS) showing huge plumes2; (at the bottom) – Map of concentration of aerosols2
I used the amazing tool Sentinel Playground to verify if the fire described by Maxime was captured by Sentinel 2 (S2) and especially if it was possible to monitor its spread and its damages. Done! The figure below shows 8 S2 acquisitions between on 16/07 and 04/09 from only several kilometers up to Igarka. Thanks to a false color composite where the band 12 (the thermal channel, SWIR) is placed in the red channel, forest areas affected by the fire can be clearly distinguished. By carefully observing, the flames on the front line of the fire are even visible on 19/07, 23/07 and 26/07. Despite some clouds, this time series allows learning a little more on burned areas and the spread of fire.
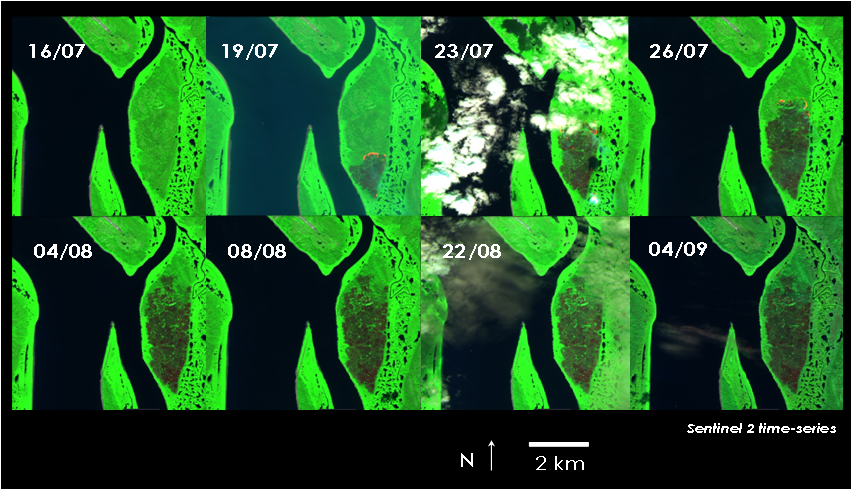
Sentinel 2 time series of the forest fire in Igarka (67°28’19”N, 86°33’31”E)
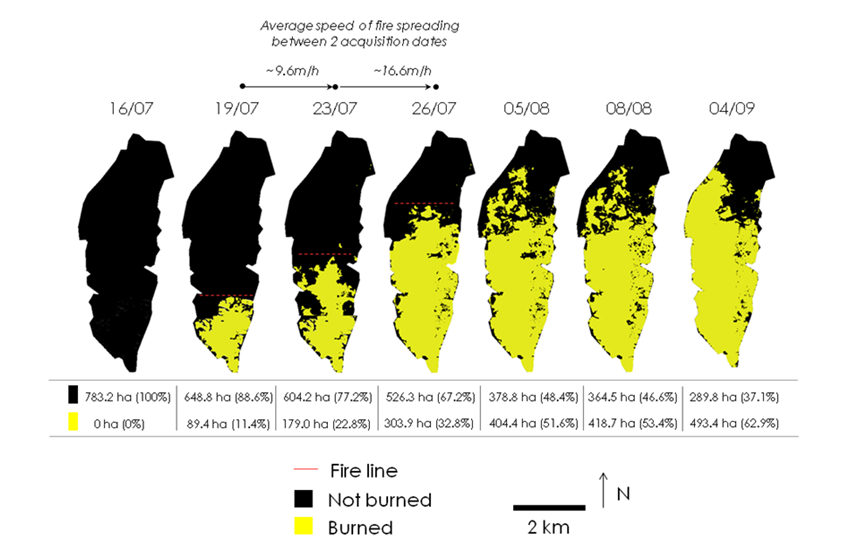
After roughly delineating the affected zone, we have performed a supervised classification based on a tree decision algorithm (CART3) for each S2 scene. The number of training samples varies at each date since the goal was to get as the more accurate classification as possible and not necessarily providing an operational processing chain for this type of work. Only the S2 scene from 22/08 was not selected for analysis because of too much hazing effects. Thus, the figure below illustrates classification results for each date where burnt/not burnt forest areas have been computed and reported under each of them. We can see that the fire has widely spread in a 10 days period after its starting (about 19/07) where burnt areas have doubled between on 19/07 and 23/07 and then between on 23/07 and 26/07. Furthermore, by approximately drawing a line on the front of the fire, we can say that the fire has moved from North to South at an average speed of 10m/h during the first period (19/07-23/07) and 17m/h in the second one (23/07-26/07). In a second stage (from 05/08), the fire has stopped advancing but encircled zones have continued to burn. It is visible on 08/08 and 04/09. Nonetheless, classification results on 23/07 are imperfects because of cloud shadows effects and some areas in the south were not classified as “burnt” whereas they were on 19/07. Therefore, burnt areas are probably under-estimated at this date.
Classification results of burnt and not burnt forest areas based on a supervised tree decision algorithm (CART)
This is a good example of the possibility offered by Sentinel-2 for monitoring fast natural phenomena in sparsely populated regions. If some readers are better qualified than we are on this topic and want to pursue this work, we remain available for any questions. Thanks to Simon Gascoin for his help! 1http://gizmodo.com/siberia-has-been-burning-all-summer-17869393622http://earthobservatory.nasa.gov/IOTD/view.php?id=88792&src=eoa-iotd3Breiman, L., Friedman, J.H., Olshen, R.A., and Stone, C.I. (1984). Classification and regression trees. Belmont, Calif.: Wadsworth.