Rain-on-snow flood in Nebraska
Several areas in Nebraska experienced record flooding this past week.
The flood was caused by a « bomb cyclone » storm, which brought heavy precipitation in the Midwest.

The weather record in Omaha, Nebraska shows a dramatic pressure drop of about 44 hPa in 48 hours (nearly 24 hPa in 24 hours, which is the exact definition of a bomb cyclone). However, the amount of rainfall is not exceptional (17 mm on Wednesday according to meteoblue, better data should be available from the US national weather service).
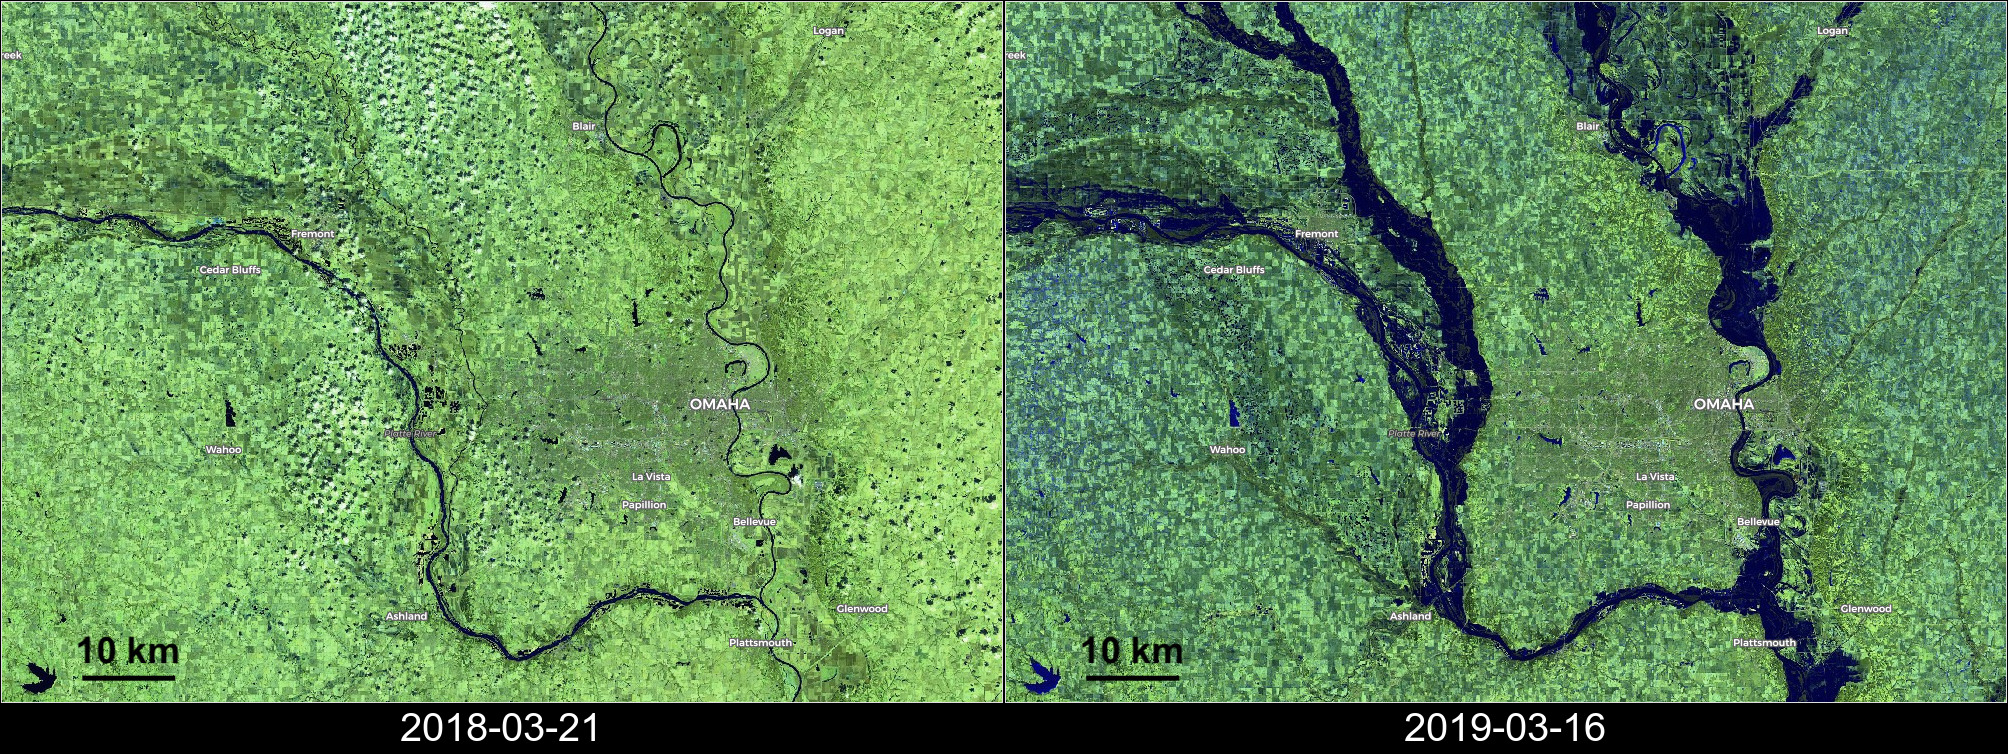
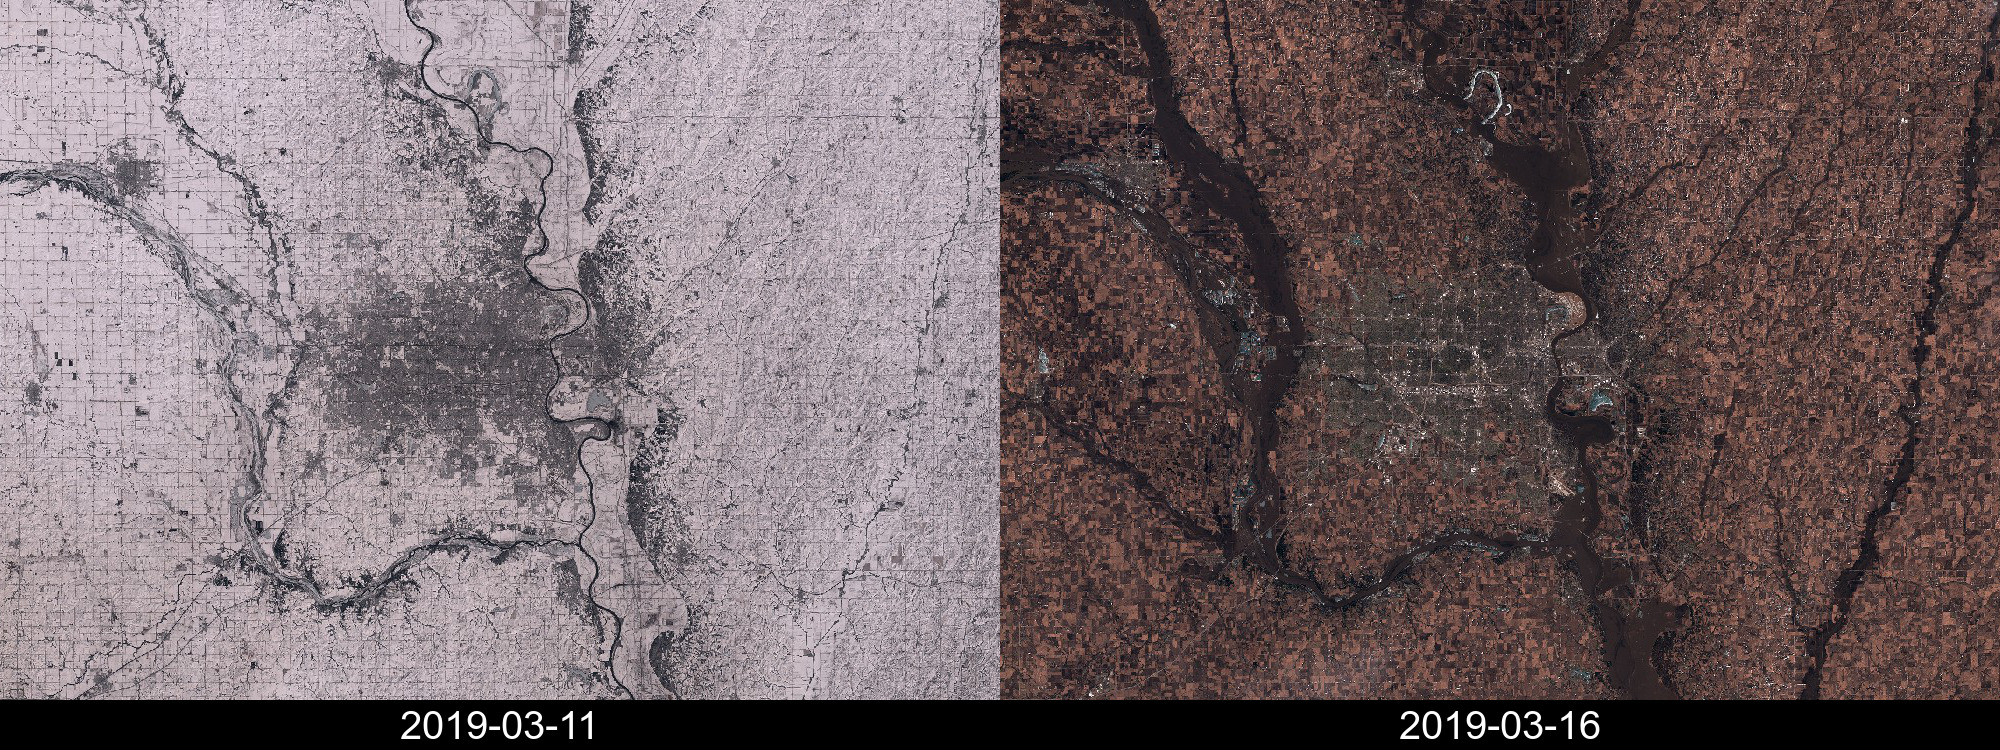
Sentinel-2 images show that the storm also caused the complete melt of the snow cover near Omaha, Nebraska within 5 days. It is likely this fast snow melt contributed to the flood, in addition to rainfall (what is called a rain-on-snow event).
Here are additional weather variables from meteoblue.com to better understand the causes of this fast melt:

I could not find much information on snow depth or snow water equivalent before the flood in this area. Previous Sentinel-2 images suggest that it was not a thin snow cover due to a recent snowfall. Snow depth measurements from the Community Collaborative Rain, Hail and Snow Network (a network of volunteer weather observers) range between 6 and 8 inches (15-20 cm) in Omaha.
Hence we can hypothesize that the following factors caused this fast snow melt:
- This late-winter snowpack in Nebraska was probably mature for melt, i.e. its temperature was close to 0°C. In this situation, any heat input causes melting.
- The storm brought warm air (hourly temperature reached 14°C on Mar 13th) which transferred heat to the snowpack by turbulent sensible heat flux.
- This turbulent heat transfer from the atmosphere to the snowpack was enhanced by the strong winds. – The storm also brought humid air, which can release substantial heat when the water vapor condenses on the snow surface.
- Warm and humid air masses emit large energy flux by longwave radiation, which was absorbed by the snowpack.- On Wed 13th, the air temperature was above 5°C hence the precipitations were liquid. Rain liquid water also contains heat which accelerated snow melt (but this effect is probably not the most important).
- The day after the storm (Mar 15th) the temperature rose again, the sky was clear and the solar radiation contributed to melt.To estimate the relative contribution of these different processes we would need to run an energy-balance model of the snowpack using accurate weather data.
Edit: The NOAA/NOHRSC provides the output of their snow reanalysis in near-real time. The map below shows that the area near Omaha was subject to intense snow melt between March 12th to 14th. According to this model the melt water added about 200 mm water equivalent to the storm rainfall in 48h only!

Rain-on-snow flood risk is projected to increase over western North America due to climate change.
PS. Thanks to Nick Wayand for telling me about the CoCoRaHS and NOHRSC webpages. I’m always amazed by the availability of meteorological data in the USA!