
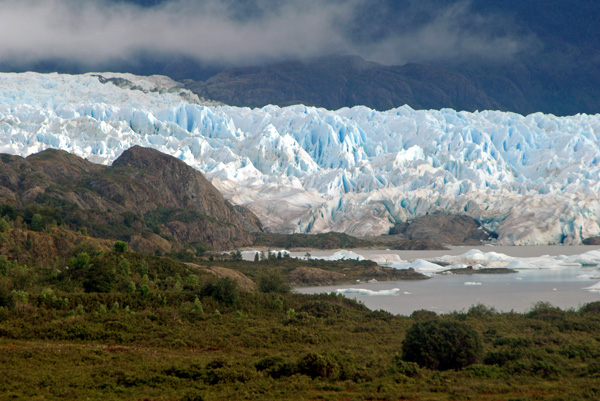
Patagonian skies are not cloudy anymore
« The most usual weather in these latitudes is a fresh wind between north west and south west with a cloudy overcast sky » – Phillip Parker King, Sailing Directions for the Coasts of Eastern and Western Patagonia (1832).
Patagonia is a beautiful place to visit but campers know that the weather is extremely variable and the sky is often cloudy. This can be a problem for glaciologists, too, since they rely on optical satellite imagery to study glacier area changes over the last decades (mainly Landsat). Clear-sky optical images can also be used to determine glacier velocity, albedo, front variations, etc.
In the Northern Patagonia Icefield, San Quintín glacier is the largest glacier (790 km²), and also the glacier that experienced the largest areal reduction from 1979 to 2001 (1) (the authors note that all the satellite images between 1979 and 2001 « are substantially cloud-covered »).
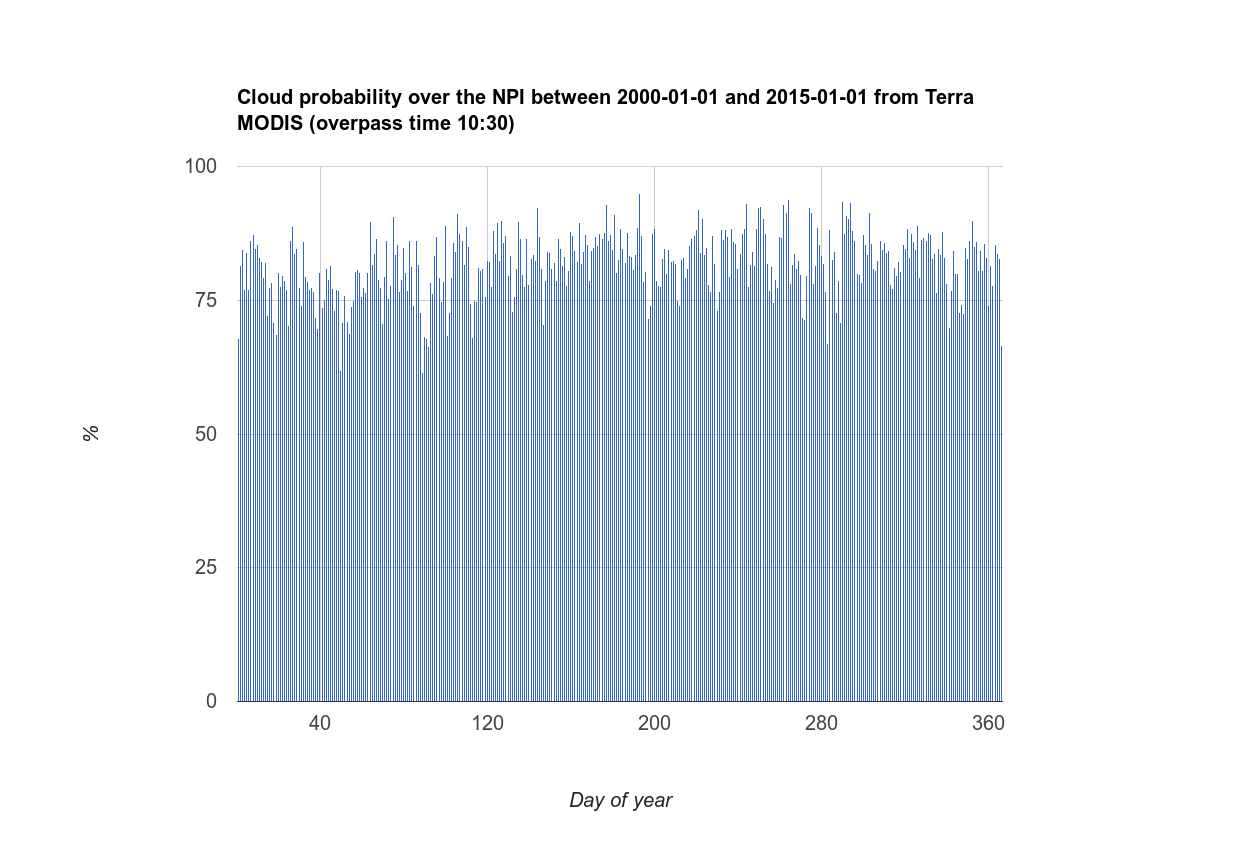
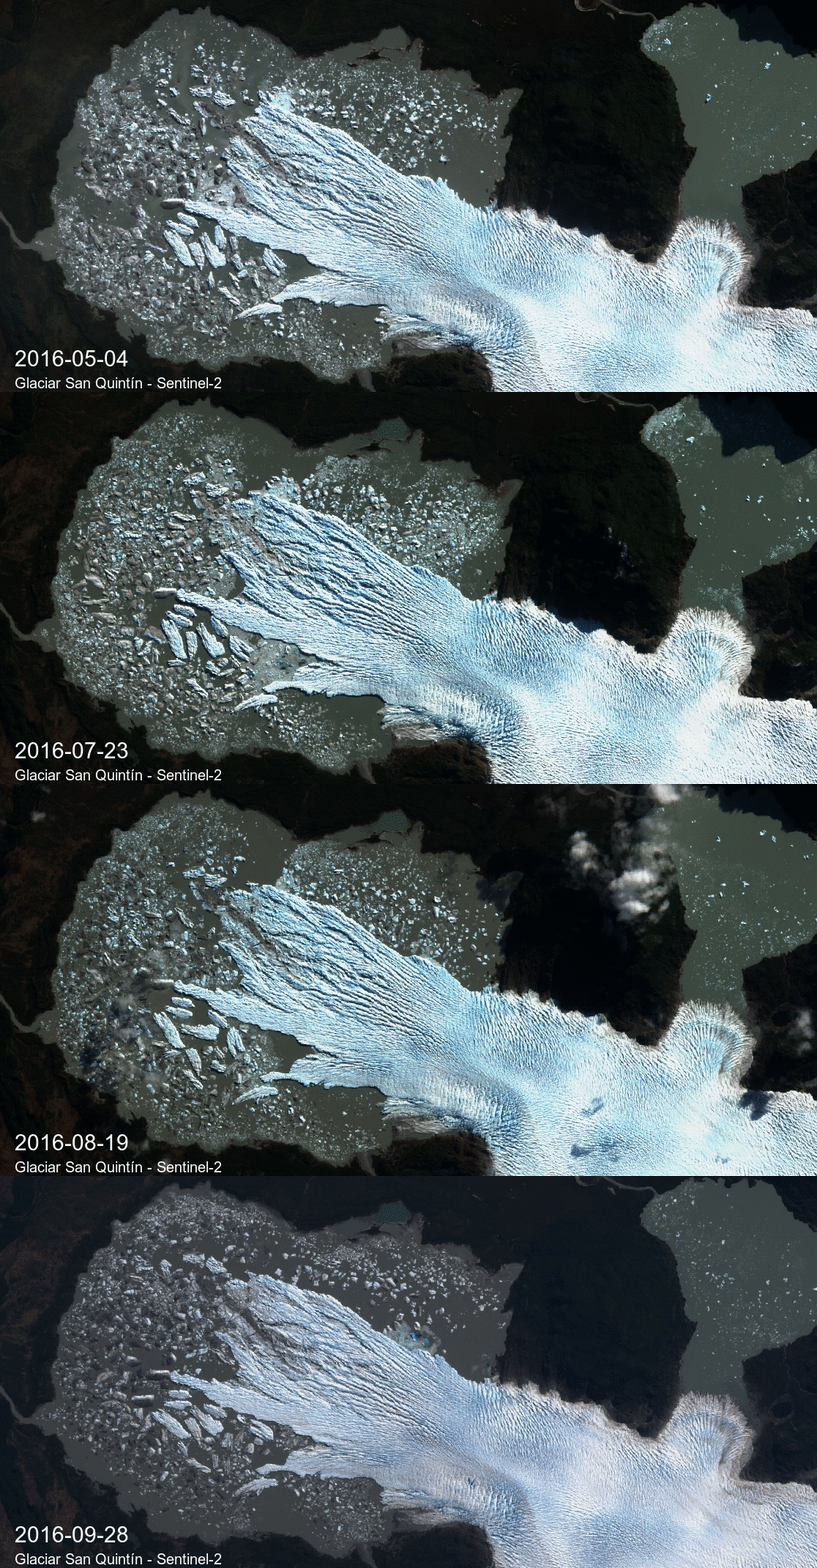
If the MODIS cloud mask is right, it means that the odds to find a clear region of 500 m by 500 m is 18%. Since December 2015, 23 Sentinel-2A images of San Quintín glacier terminus were acquired. Among these images I found 4 clear images. This is a ratio of … 17%.
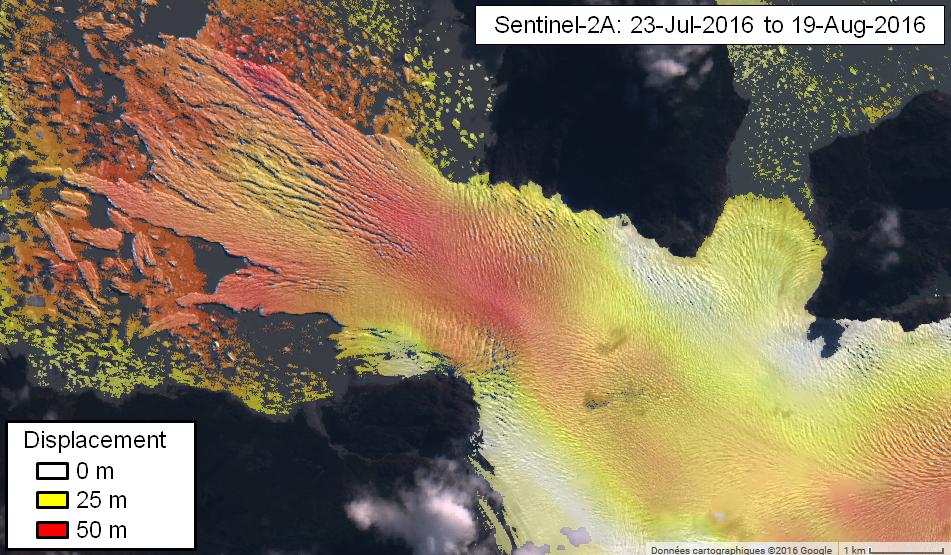
I selected two images (23-Jul-2016 and 19-Aug-2016) to compute the displacement using the register algorithm in GEE (4). The map below shows the spatial distribution of the offset between both images (magnitude of the displacement vector). The values vary between zero and 50 meters, that is up to 1.80 meter per day!
The 10 days repeat cycle of Sentinel-2A is already a significant advance for glaciological applications in cloudy areas like Patagonia.
Footnotes
[1] Rivera et al. (2007) Ice elevation and areal changes of glaciers from the Northern Patagonia Icefield, Chile, Global and Planetary Change.[2] The script to reproduce this chart is available here.
[3] Hall et al. (2006), updated daily. MODIS/Terra Snow Cover Daily L3 Global 500m Grid V005, Boulder, Colorado USA: National Snow and Ice Data Center. Digital media.
[4] The script to reproduce this map is available here. I also used it to make another displacement map of Porcupine glacier in British Columbia!

